

Metrics & Analysis walkthrough
This tutorial shows how to use the app’s metrics and analysis features. After login you’ll see a unified metrics page with all connected channels, integrations, and a set of organized KPIs. Use targets, automated reports, the daily summary email, and the MCP to monitor performance and drill into issues down to campaigns, ads, and landing pages.
Step 1: Log in and land on the metrics page.
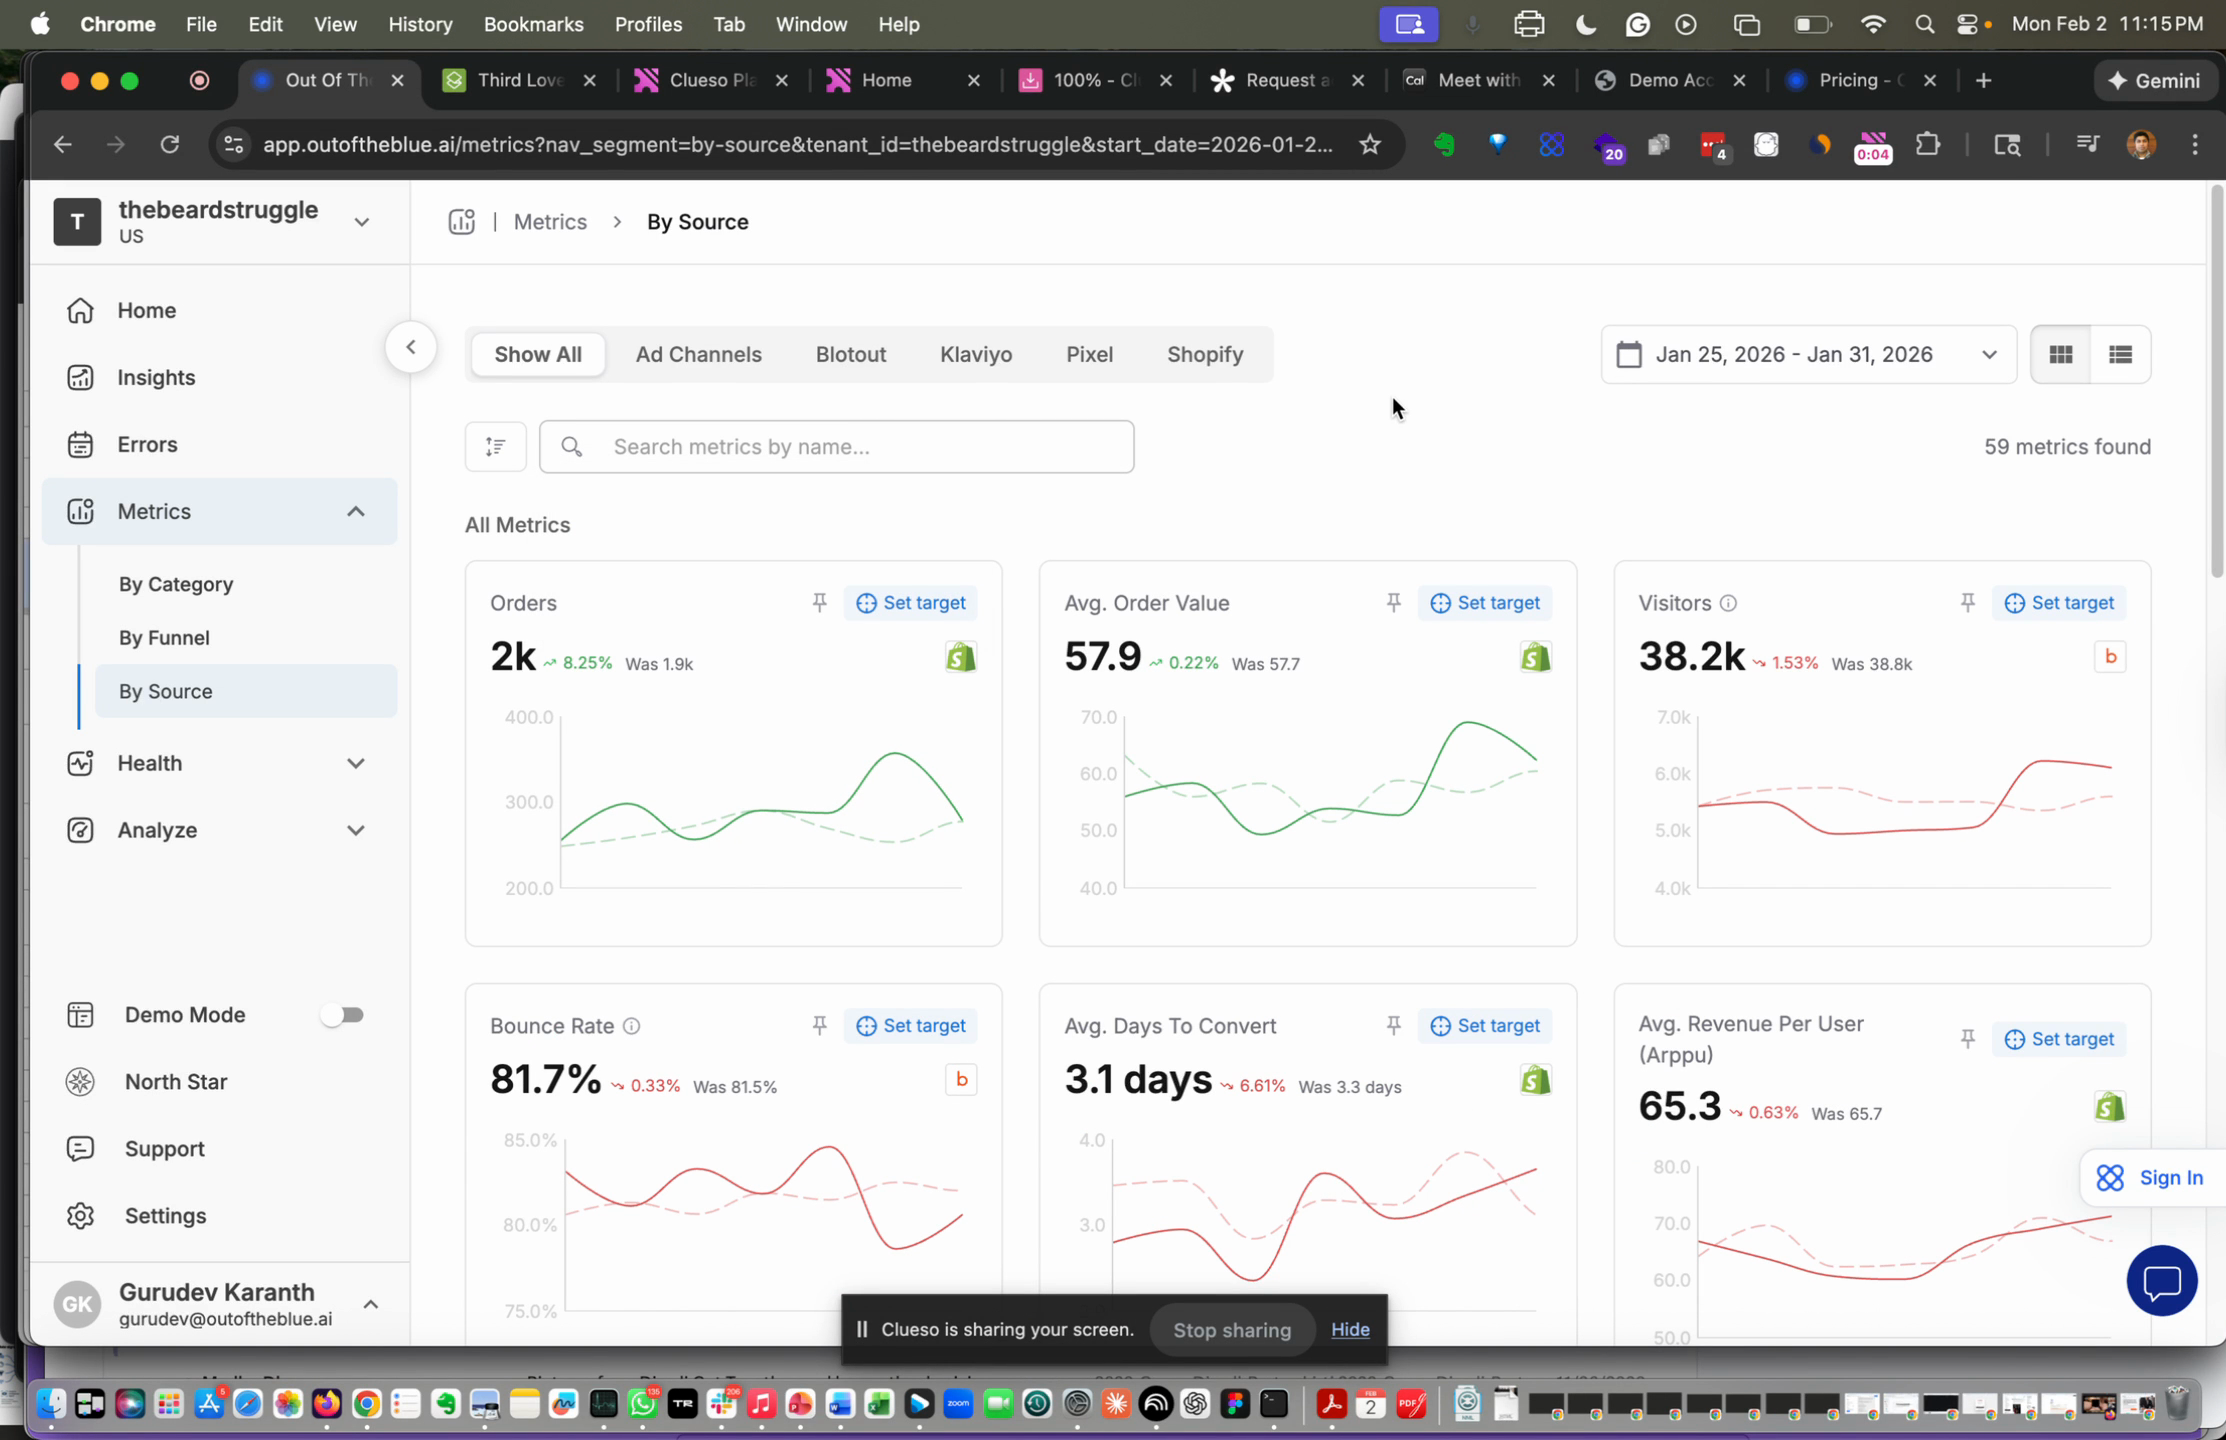
Step 2: Review connected channels like TikTok, Meta, Snap, and Google Ads.
Step 3: Confirm integrations such as Google Analytics or a CDP, your lifecycle tool like Klaviyo, the real‑time pixel, and Shopify.
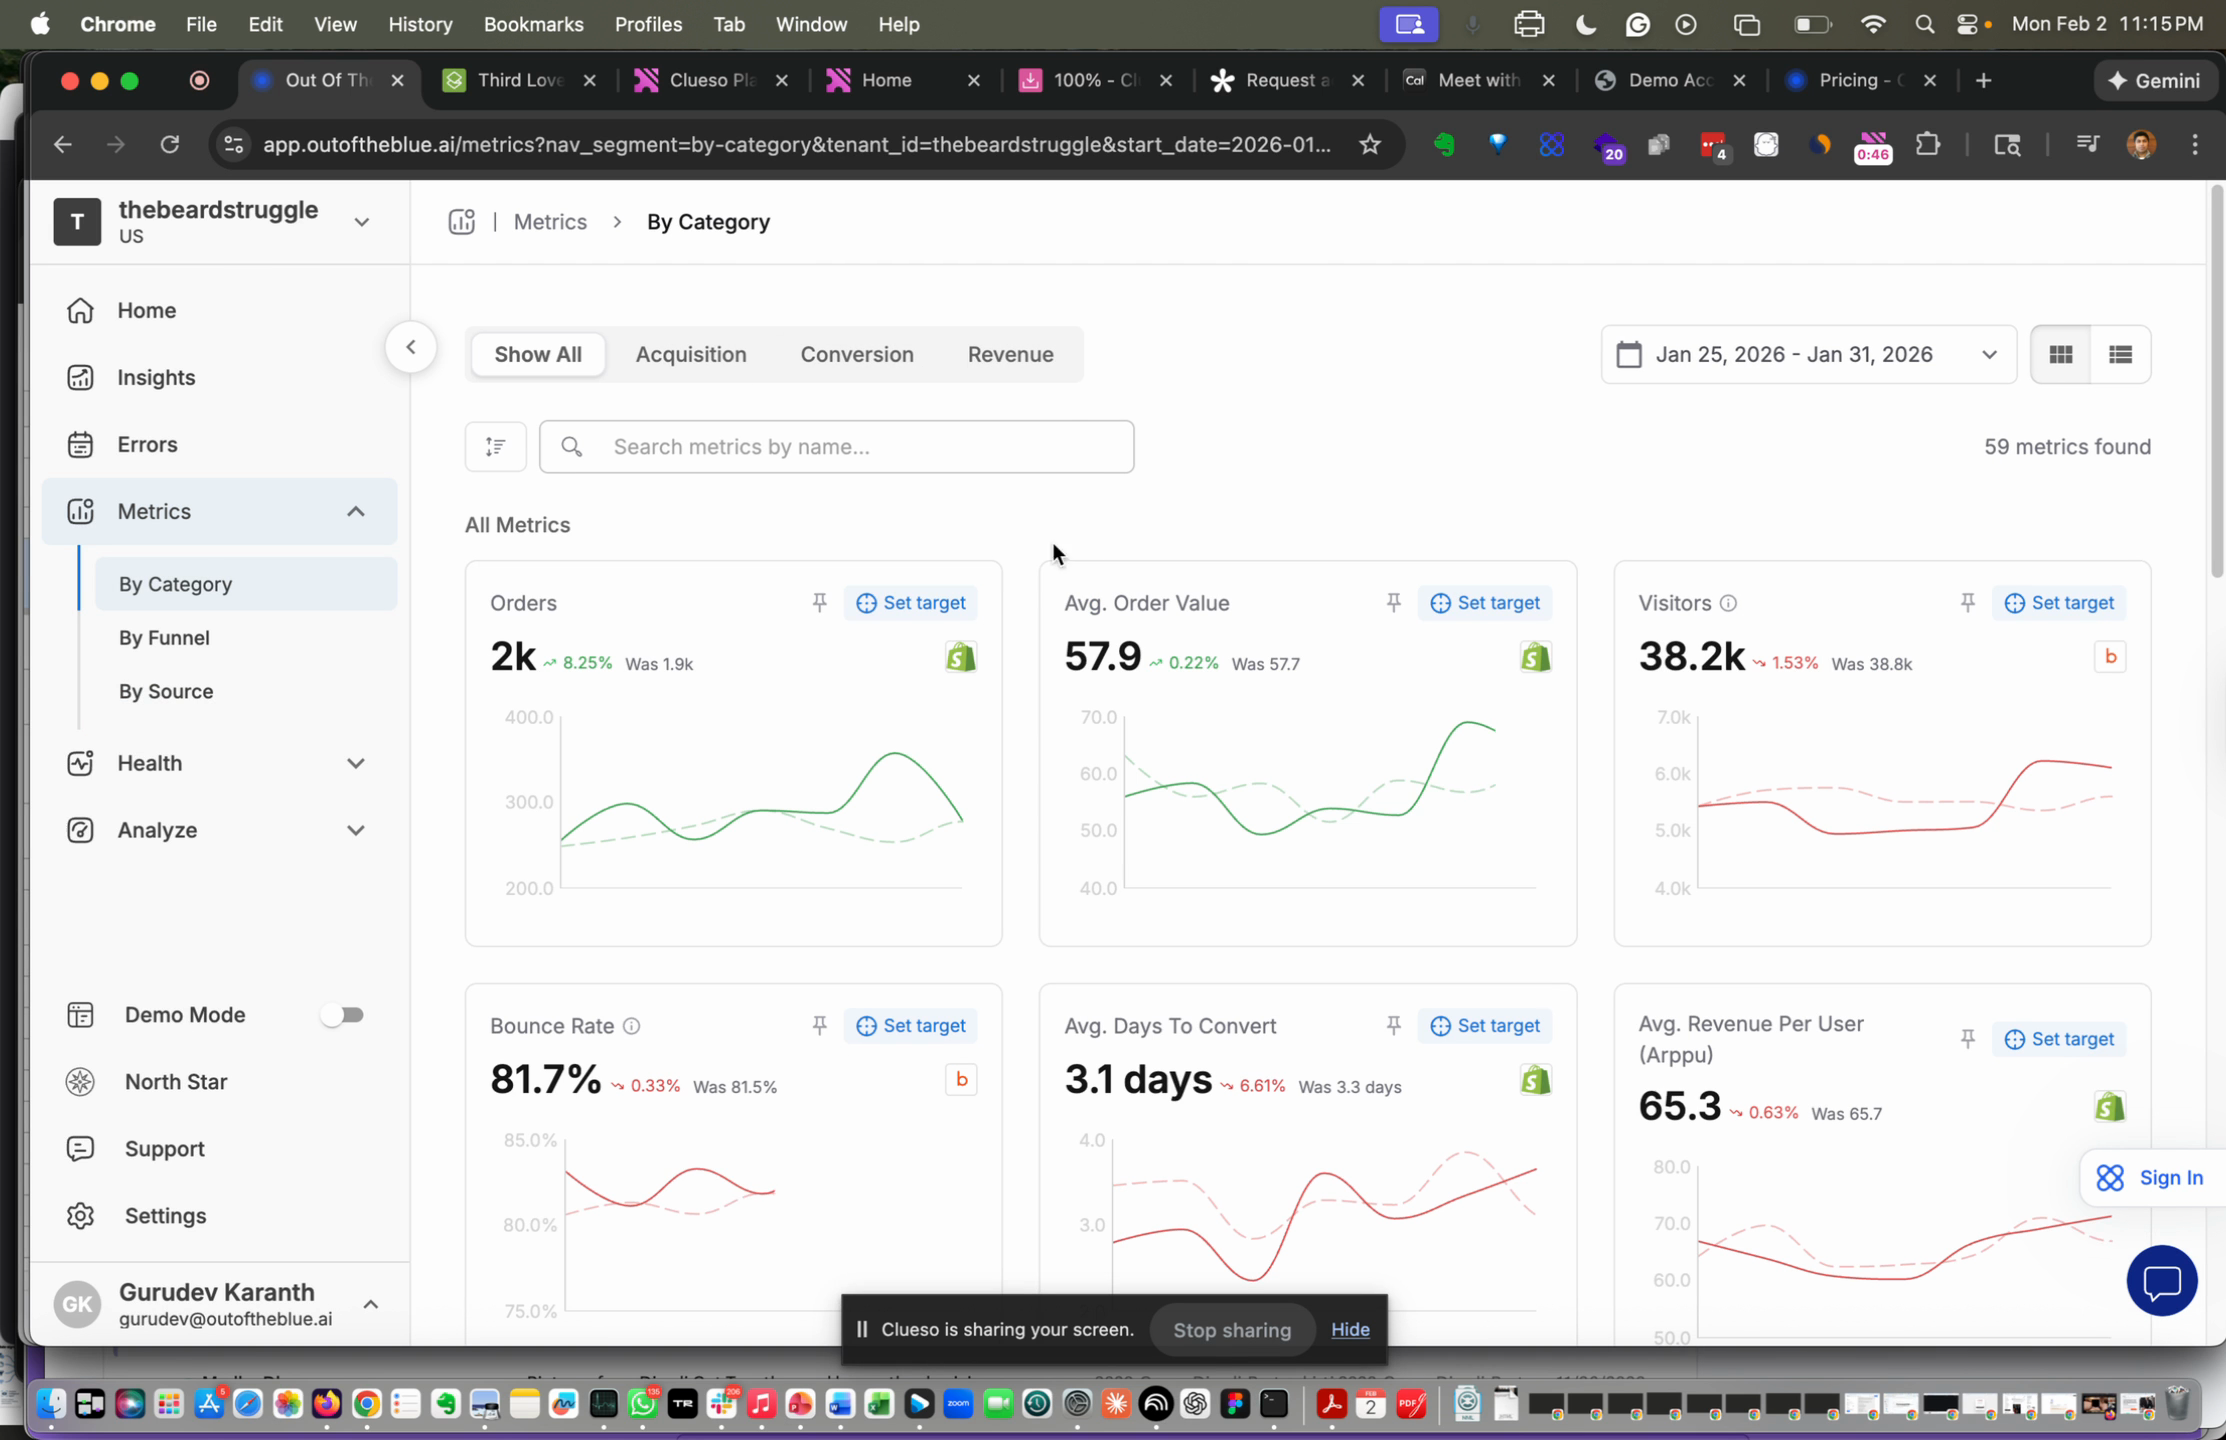
Step 4: Note total metrics and organization. Metrics appear grouped by acquisition, conversion, and revenue.
Step 5: Set targets for individual metrics. Compare against last year or last week, and configure the retail calendar to automate reporting.
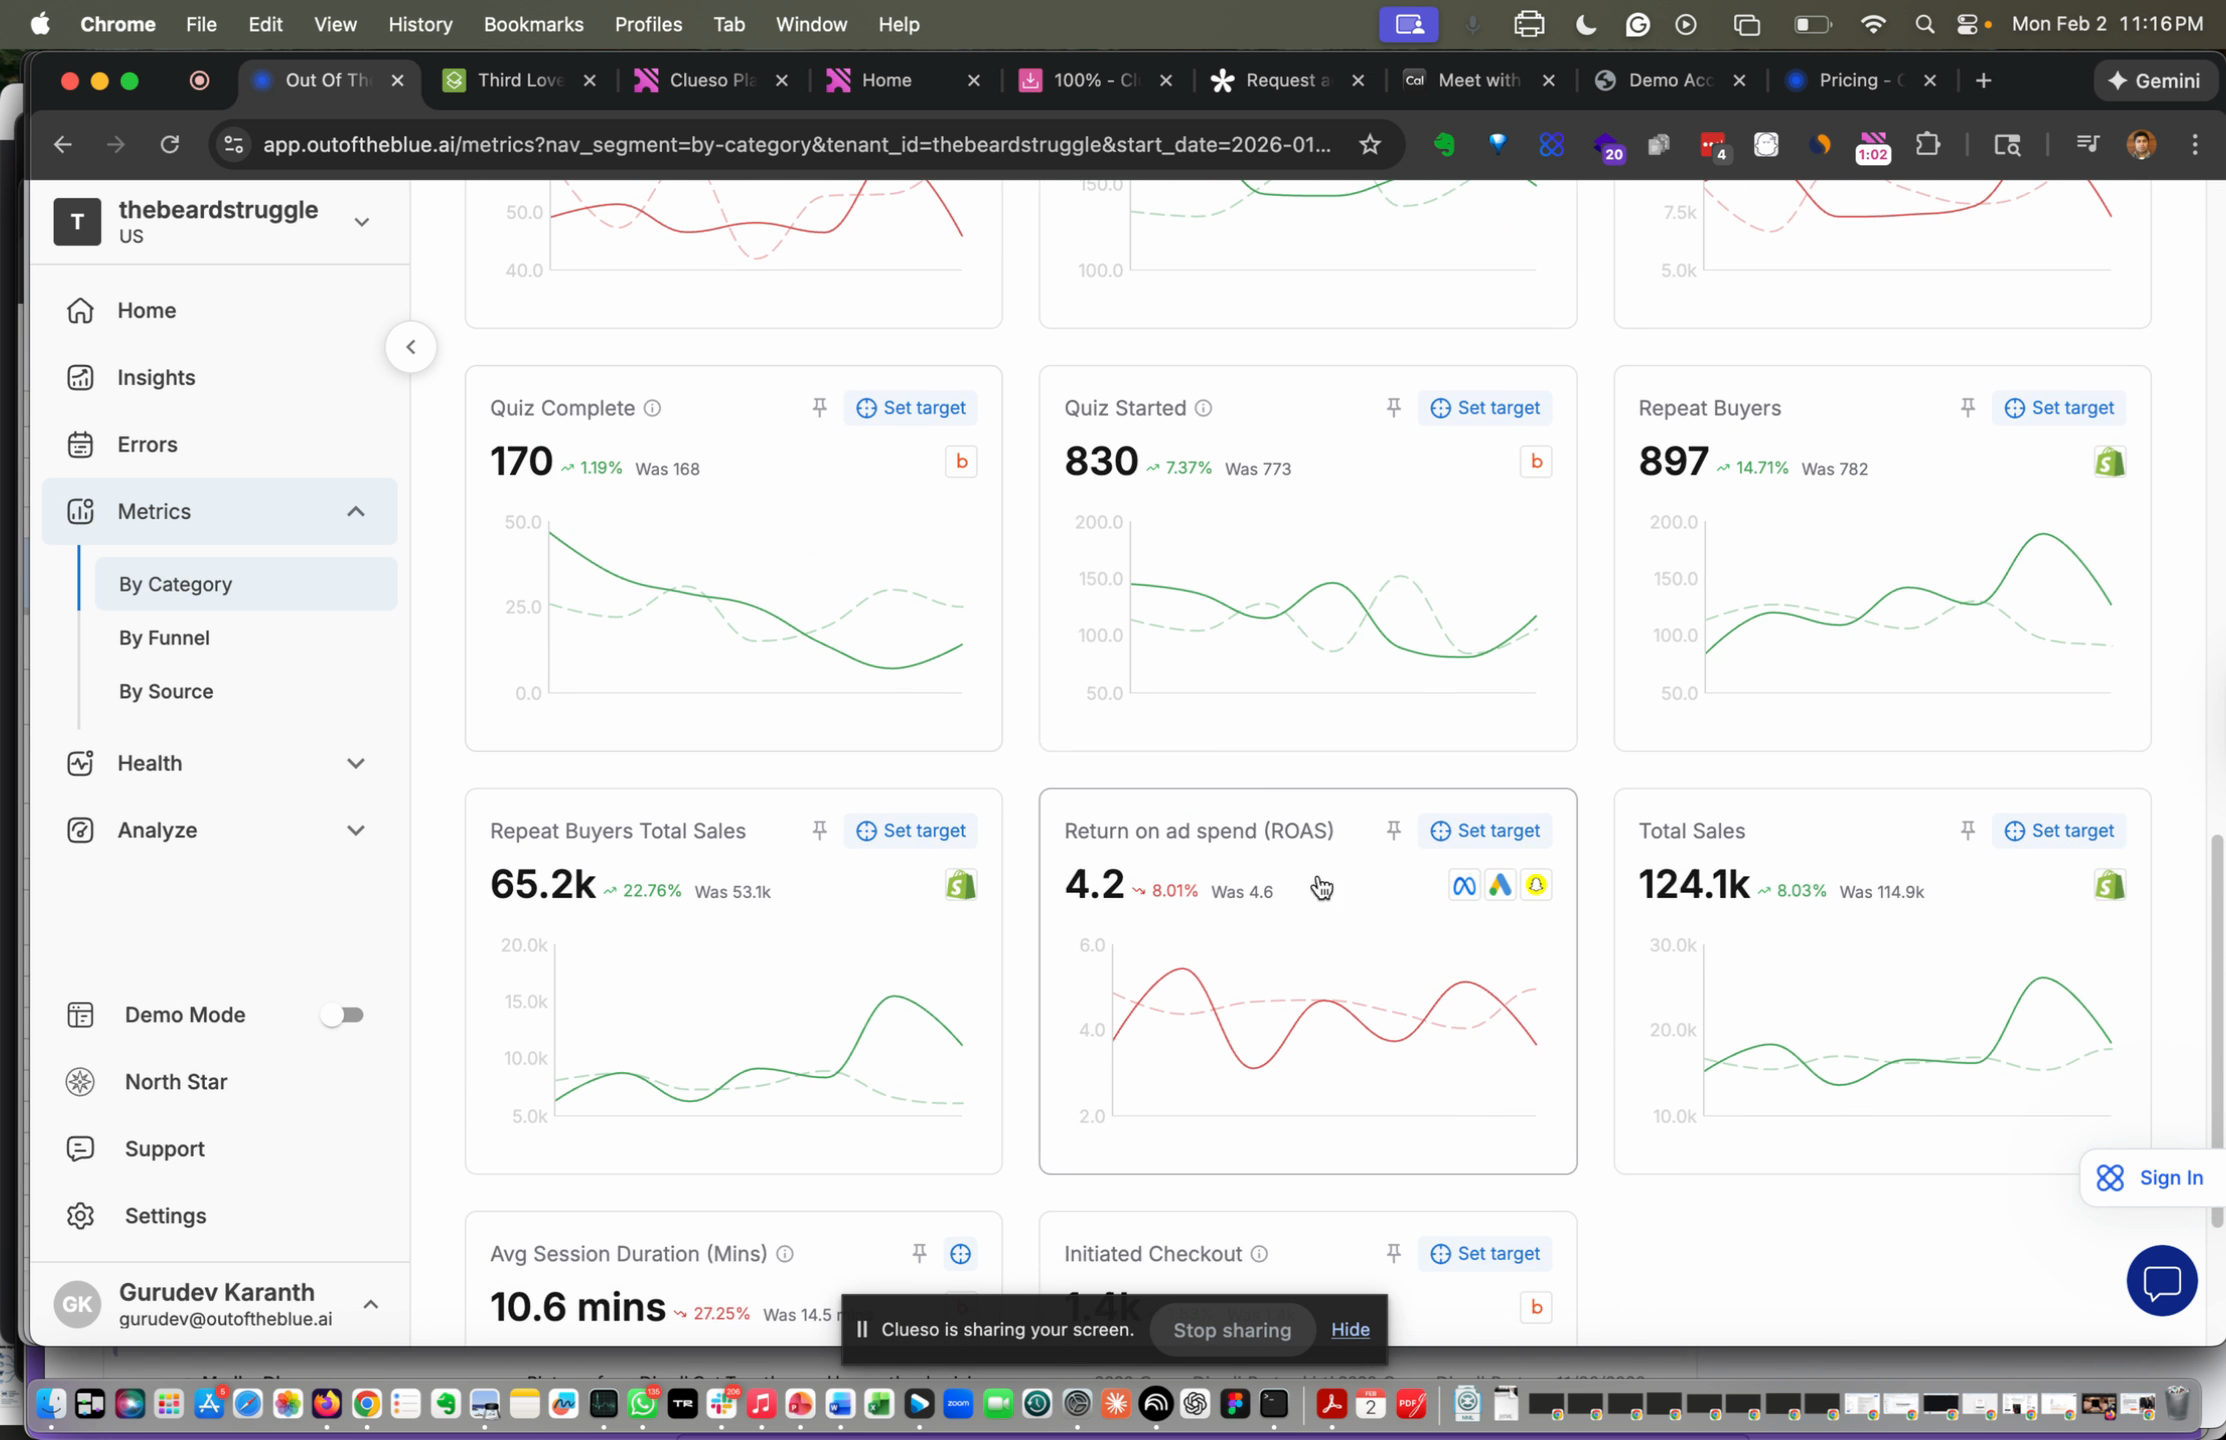
Step 6: Check blended KPIs like ROAS across channels to get a combined view.
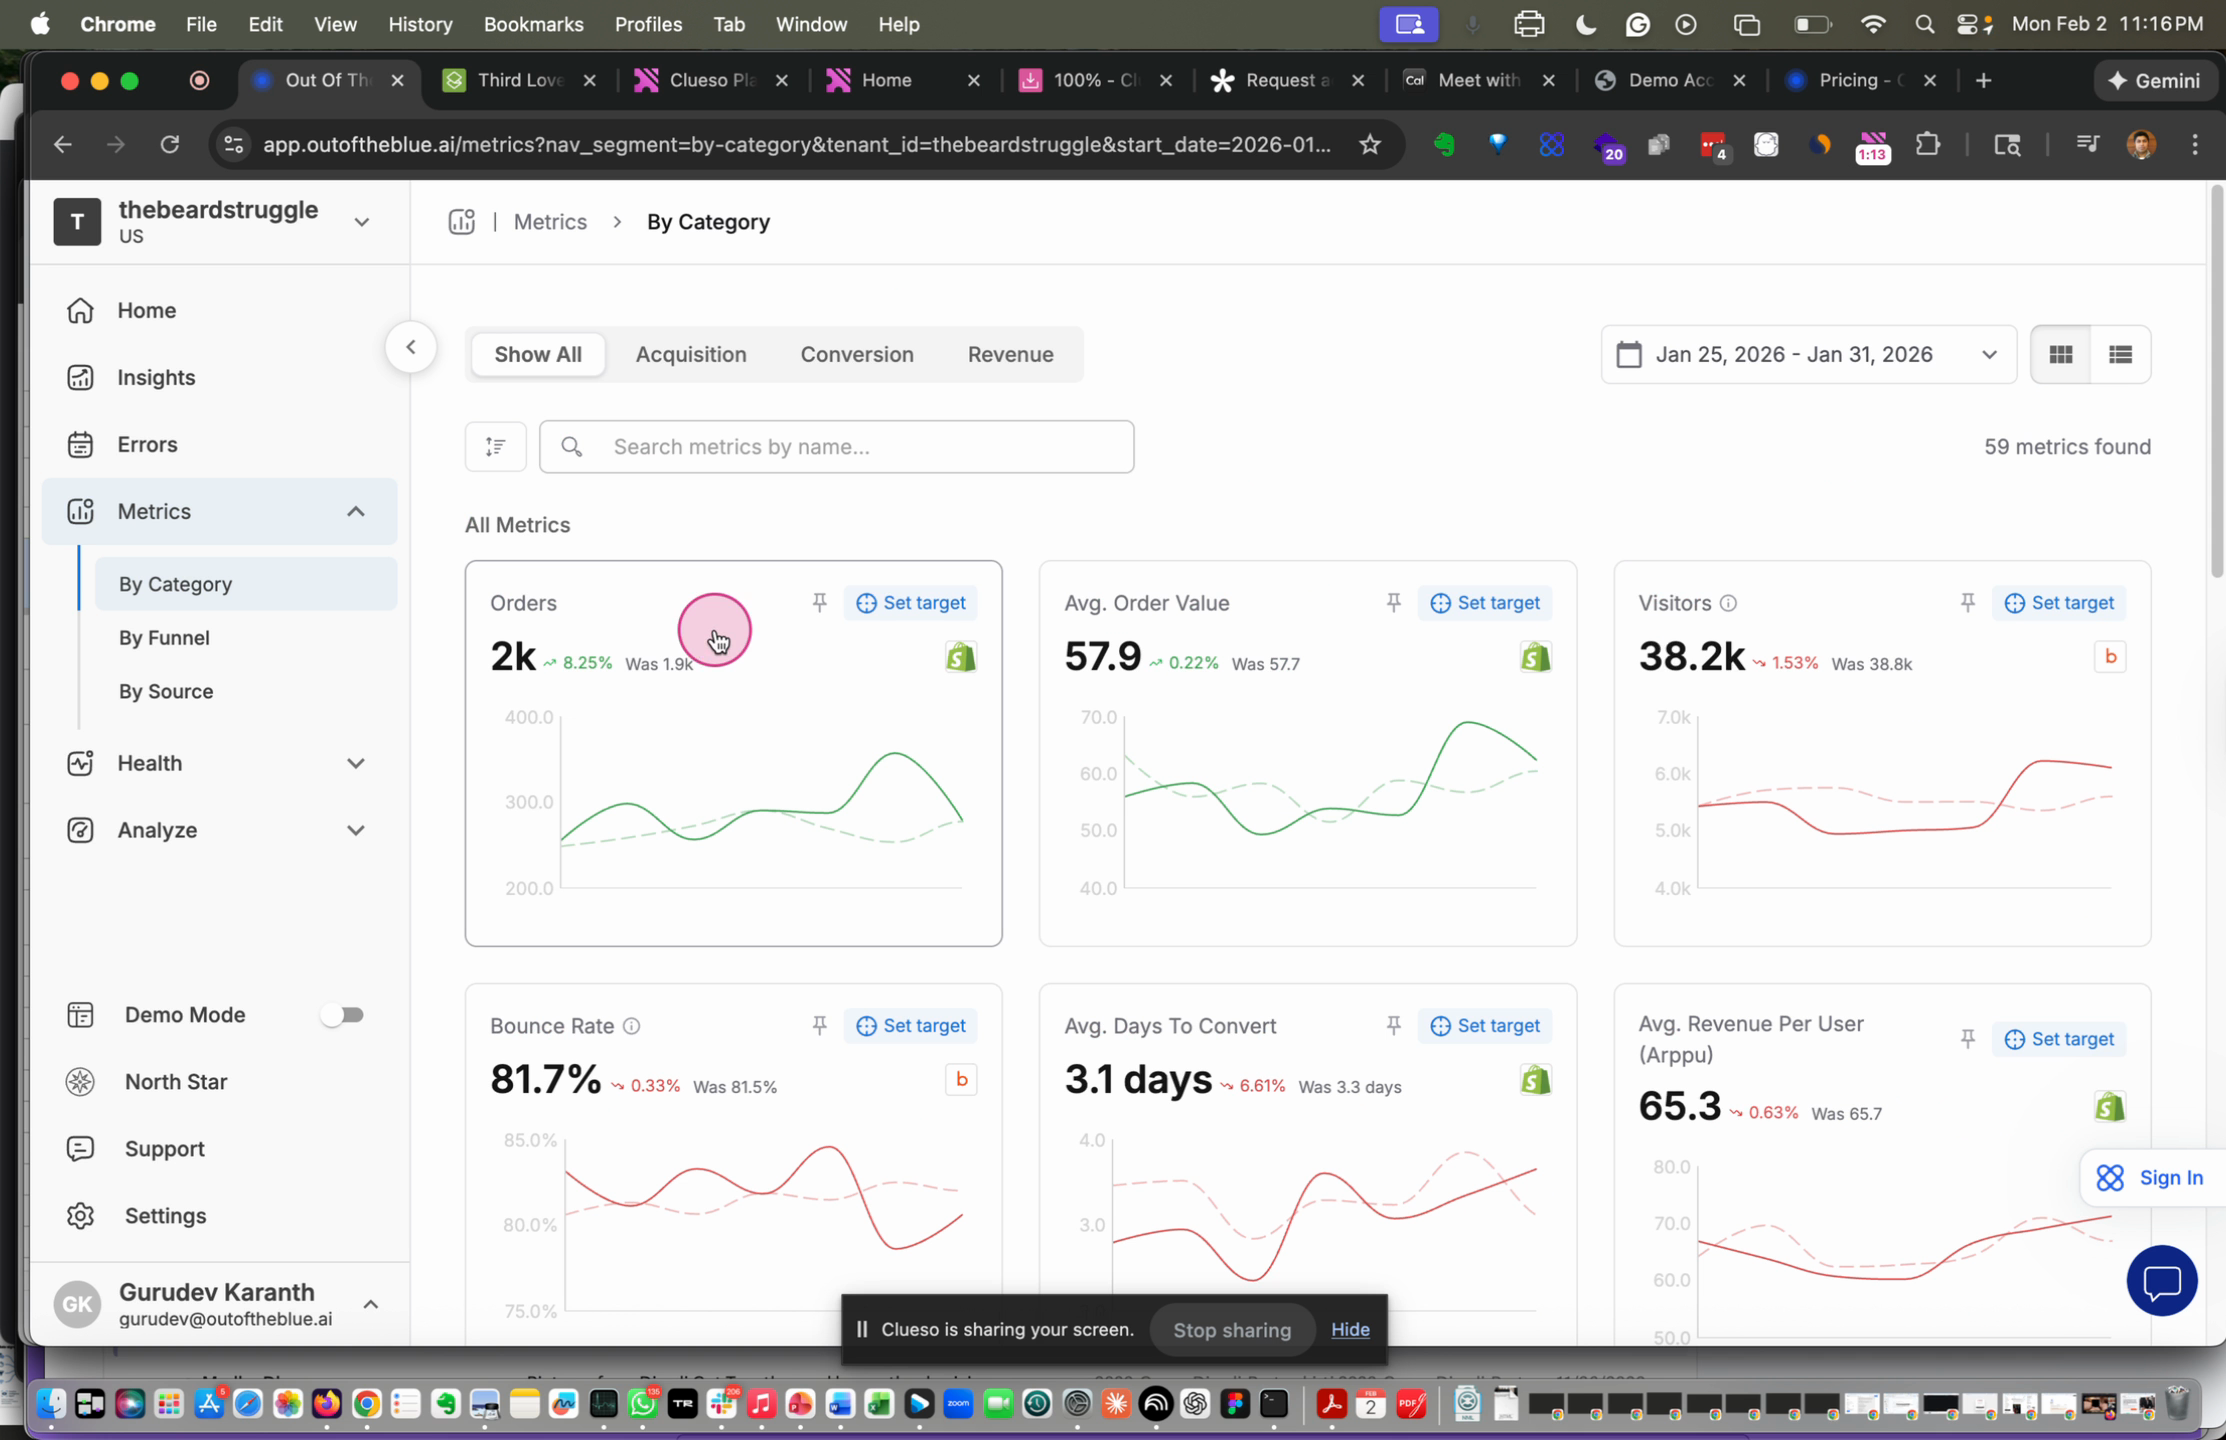
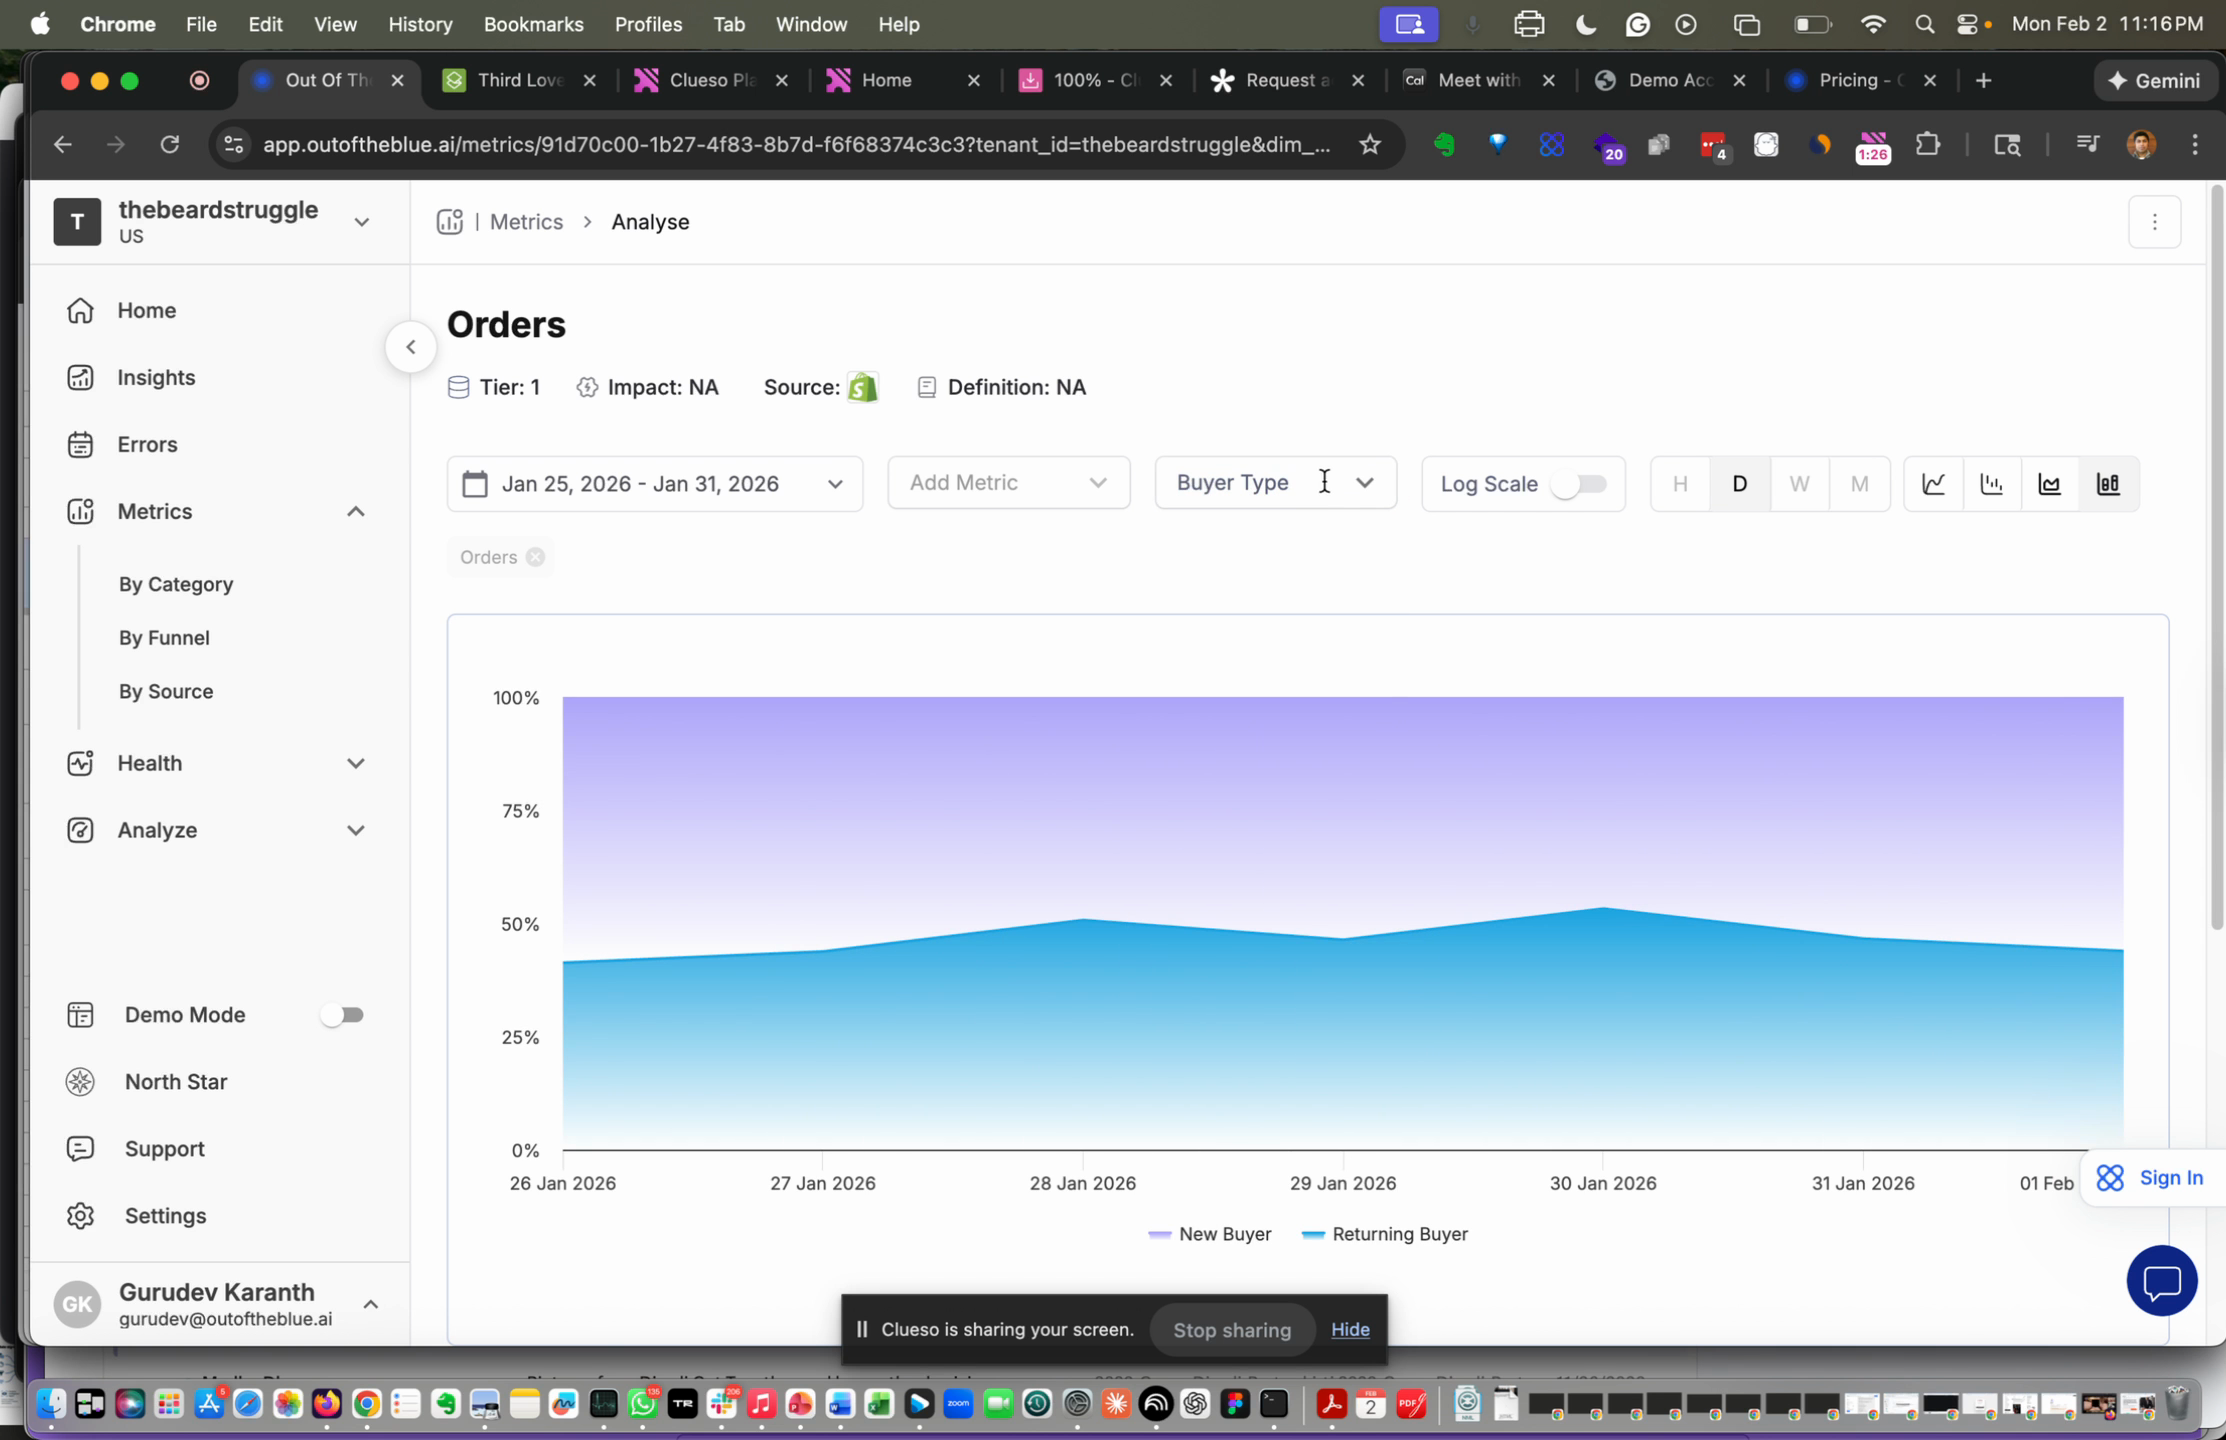
Step 7: Click any metric to open the detail view. Add dimensions and slice the data to explore underlying performance.
Step 8: Add different dimensions to break down performance by source, campaign, or other attributes.
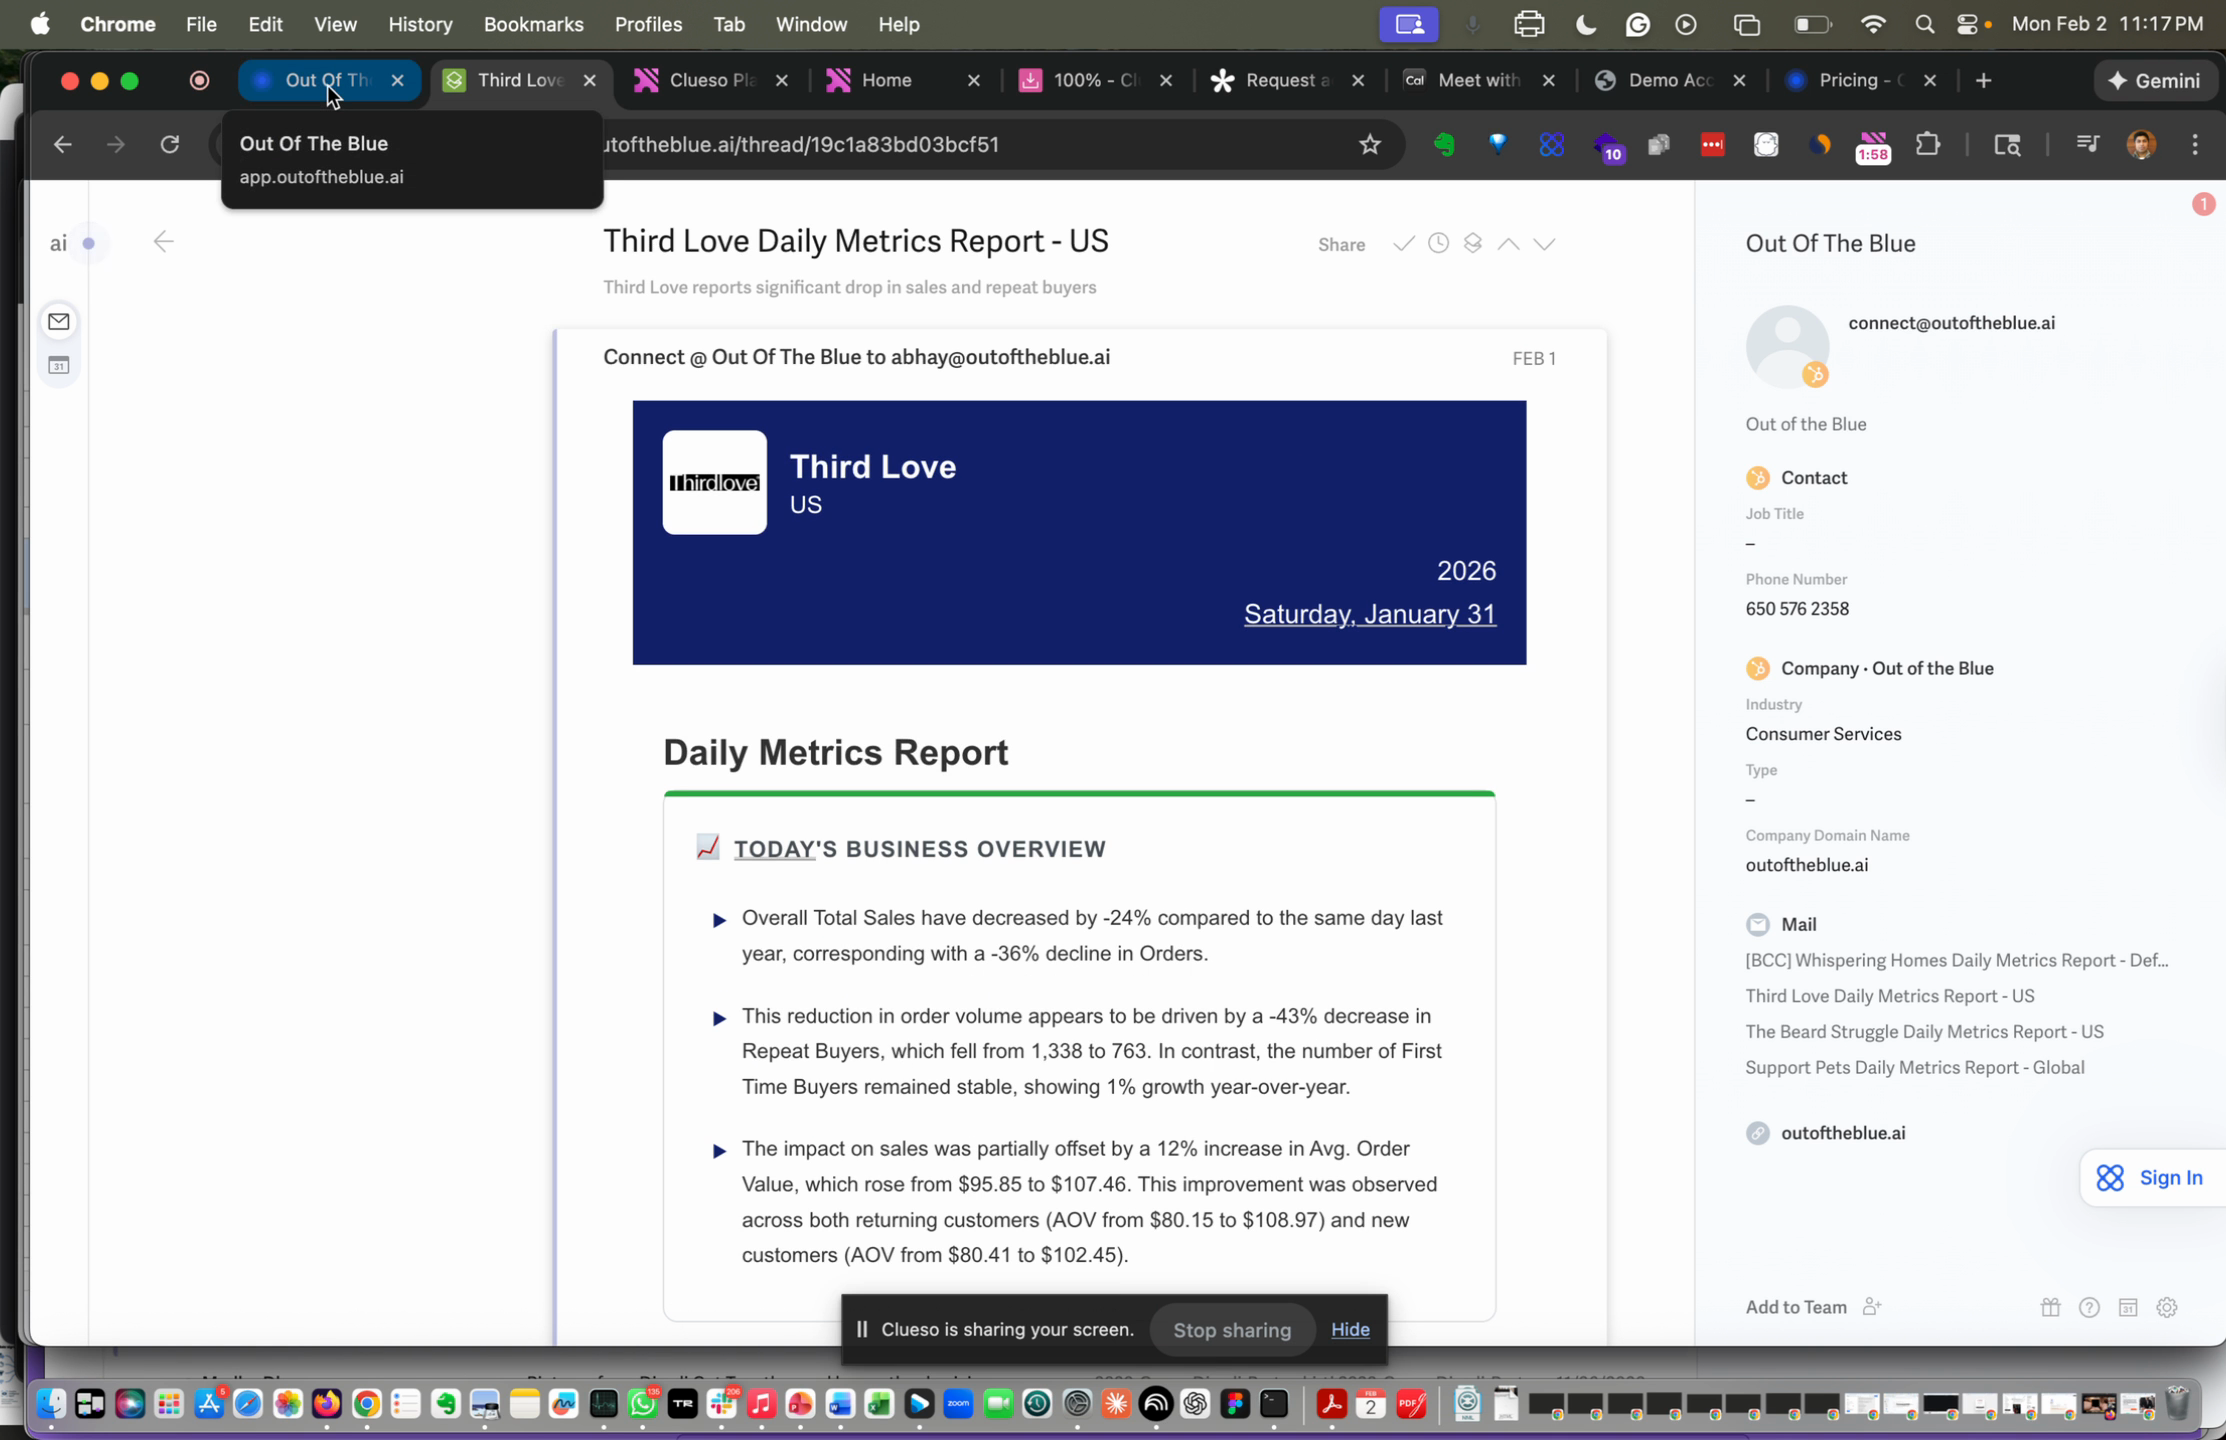
Step 9: Read the daily summary email for an automated business overview. It highlights what changed, flags “nothing changed” when relevant, lists KPIs needing review, and surface observations that need action.
Step 10: Use the MCP to query funnel questions and get quick answers across your dataset.
Step 11: Return to the Analyze dashboard to include all channels in one view. Break performance down by revenue, spend, and key metrics.
Step 12: Drill into channel-level performance to see how traffic and spend translate to revenue and other outcomes.
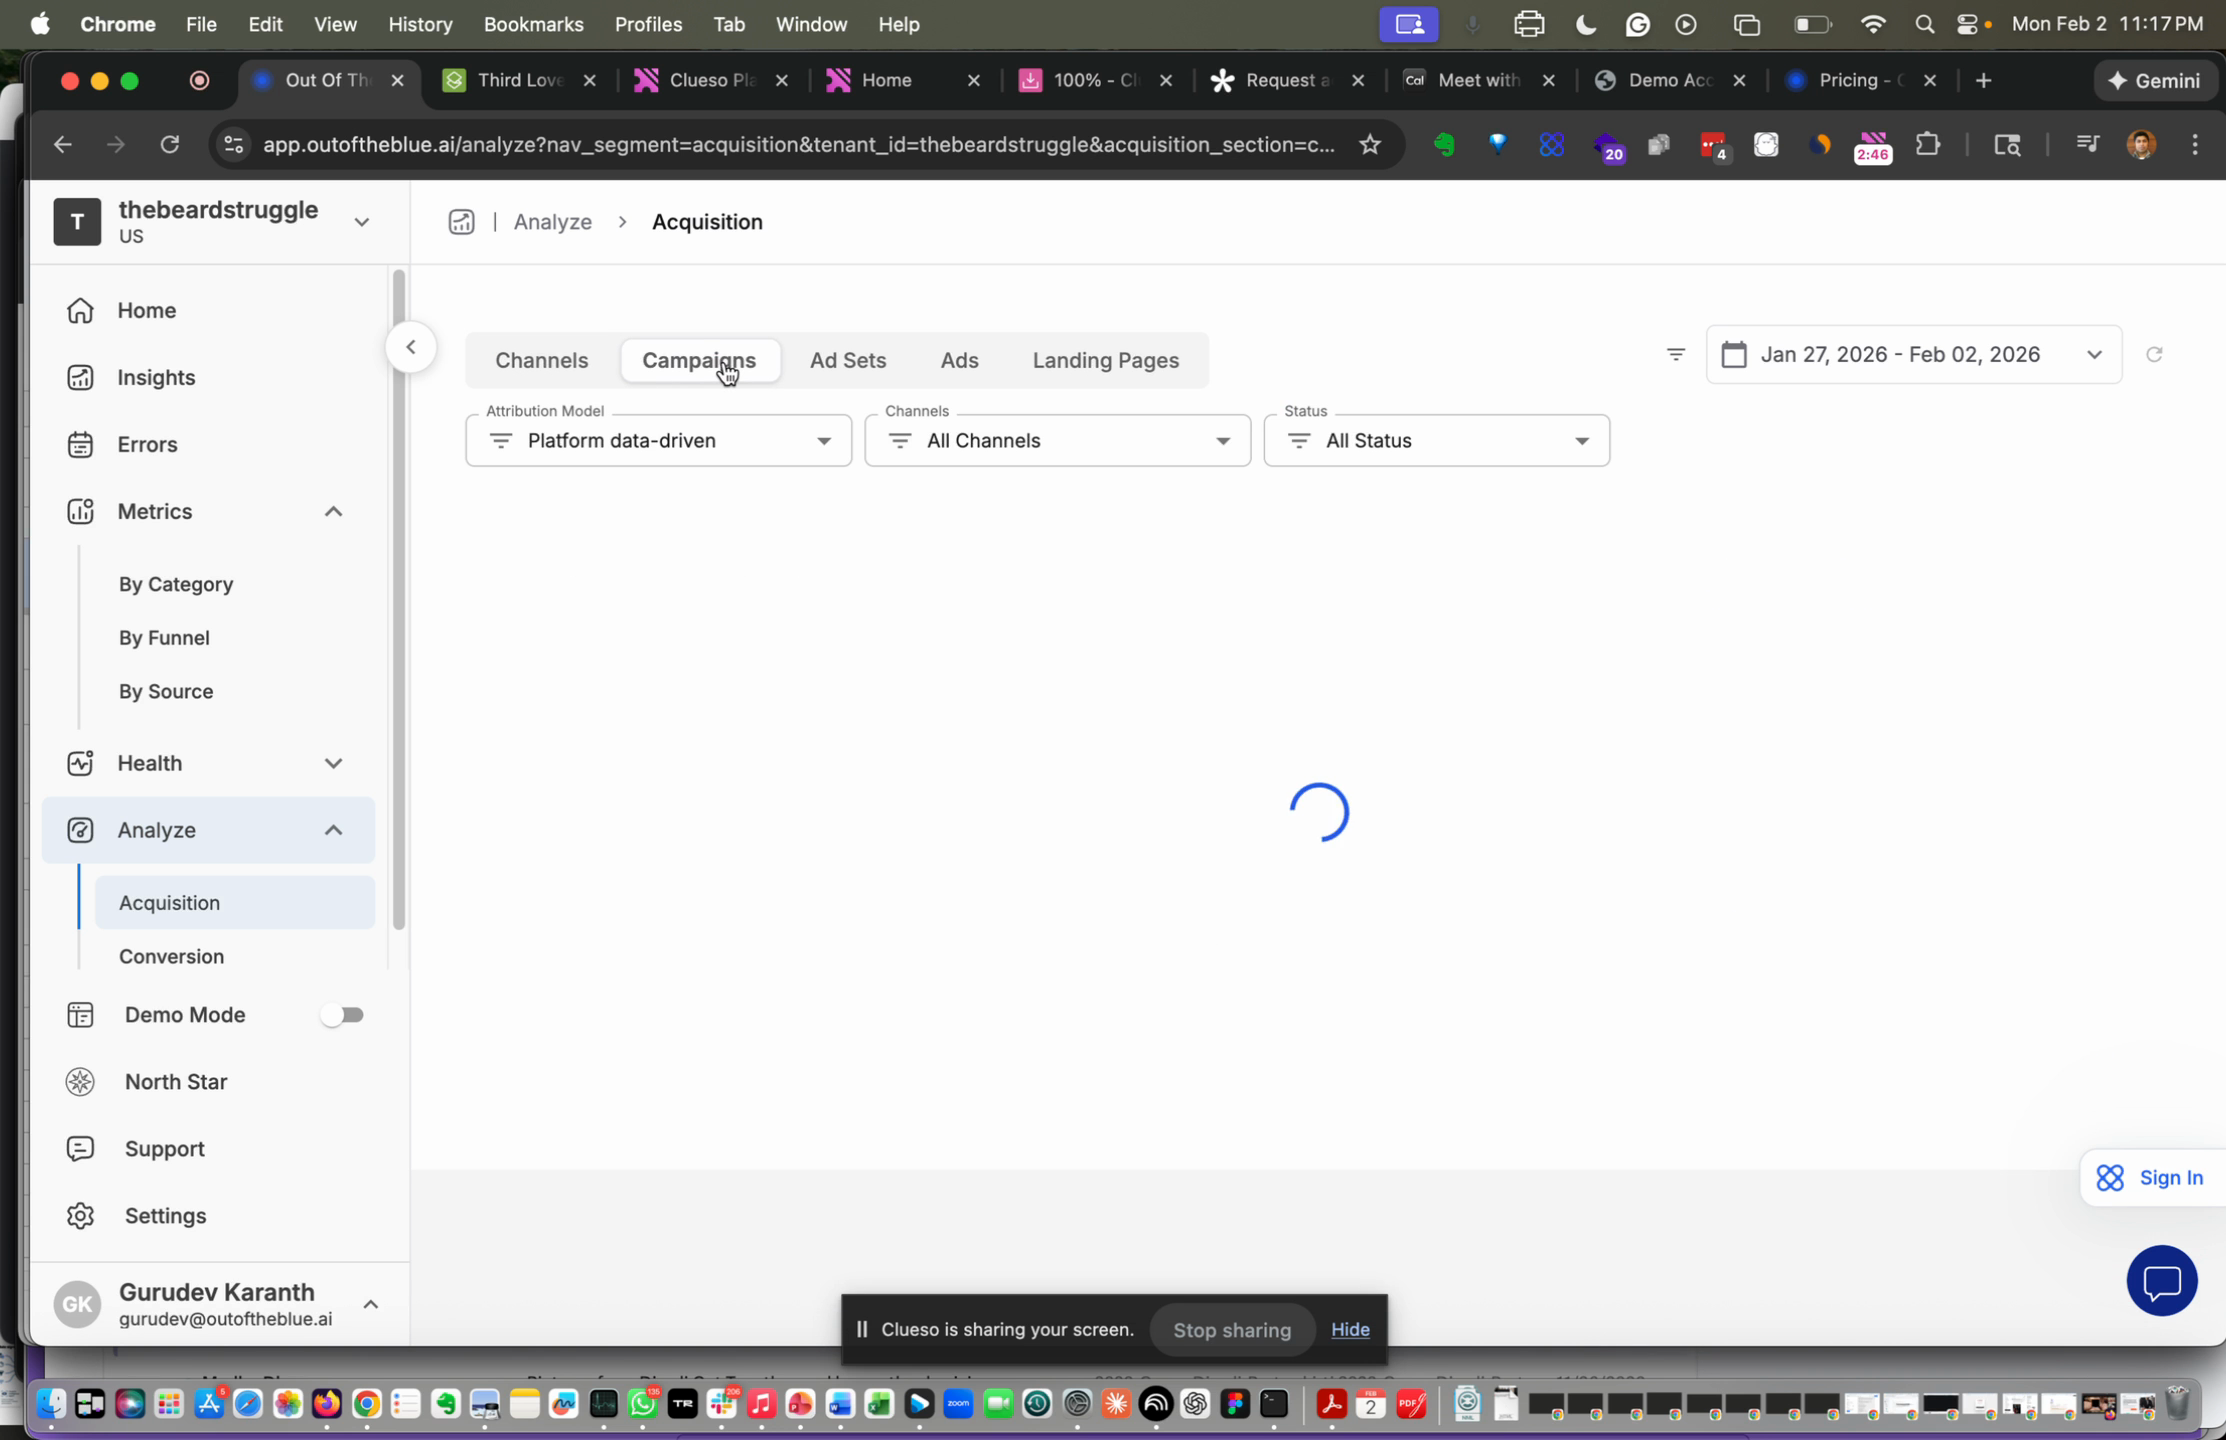
Step 13: Open campaign level reporting to see underlying campaigns for each channel.
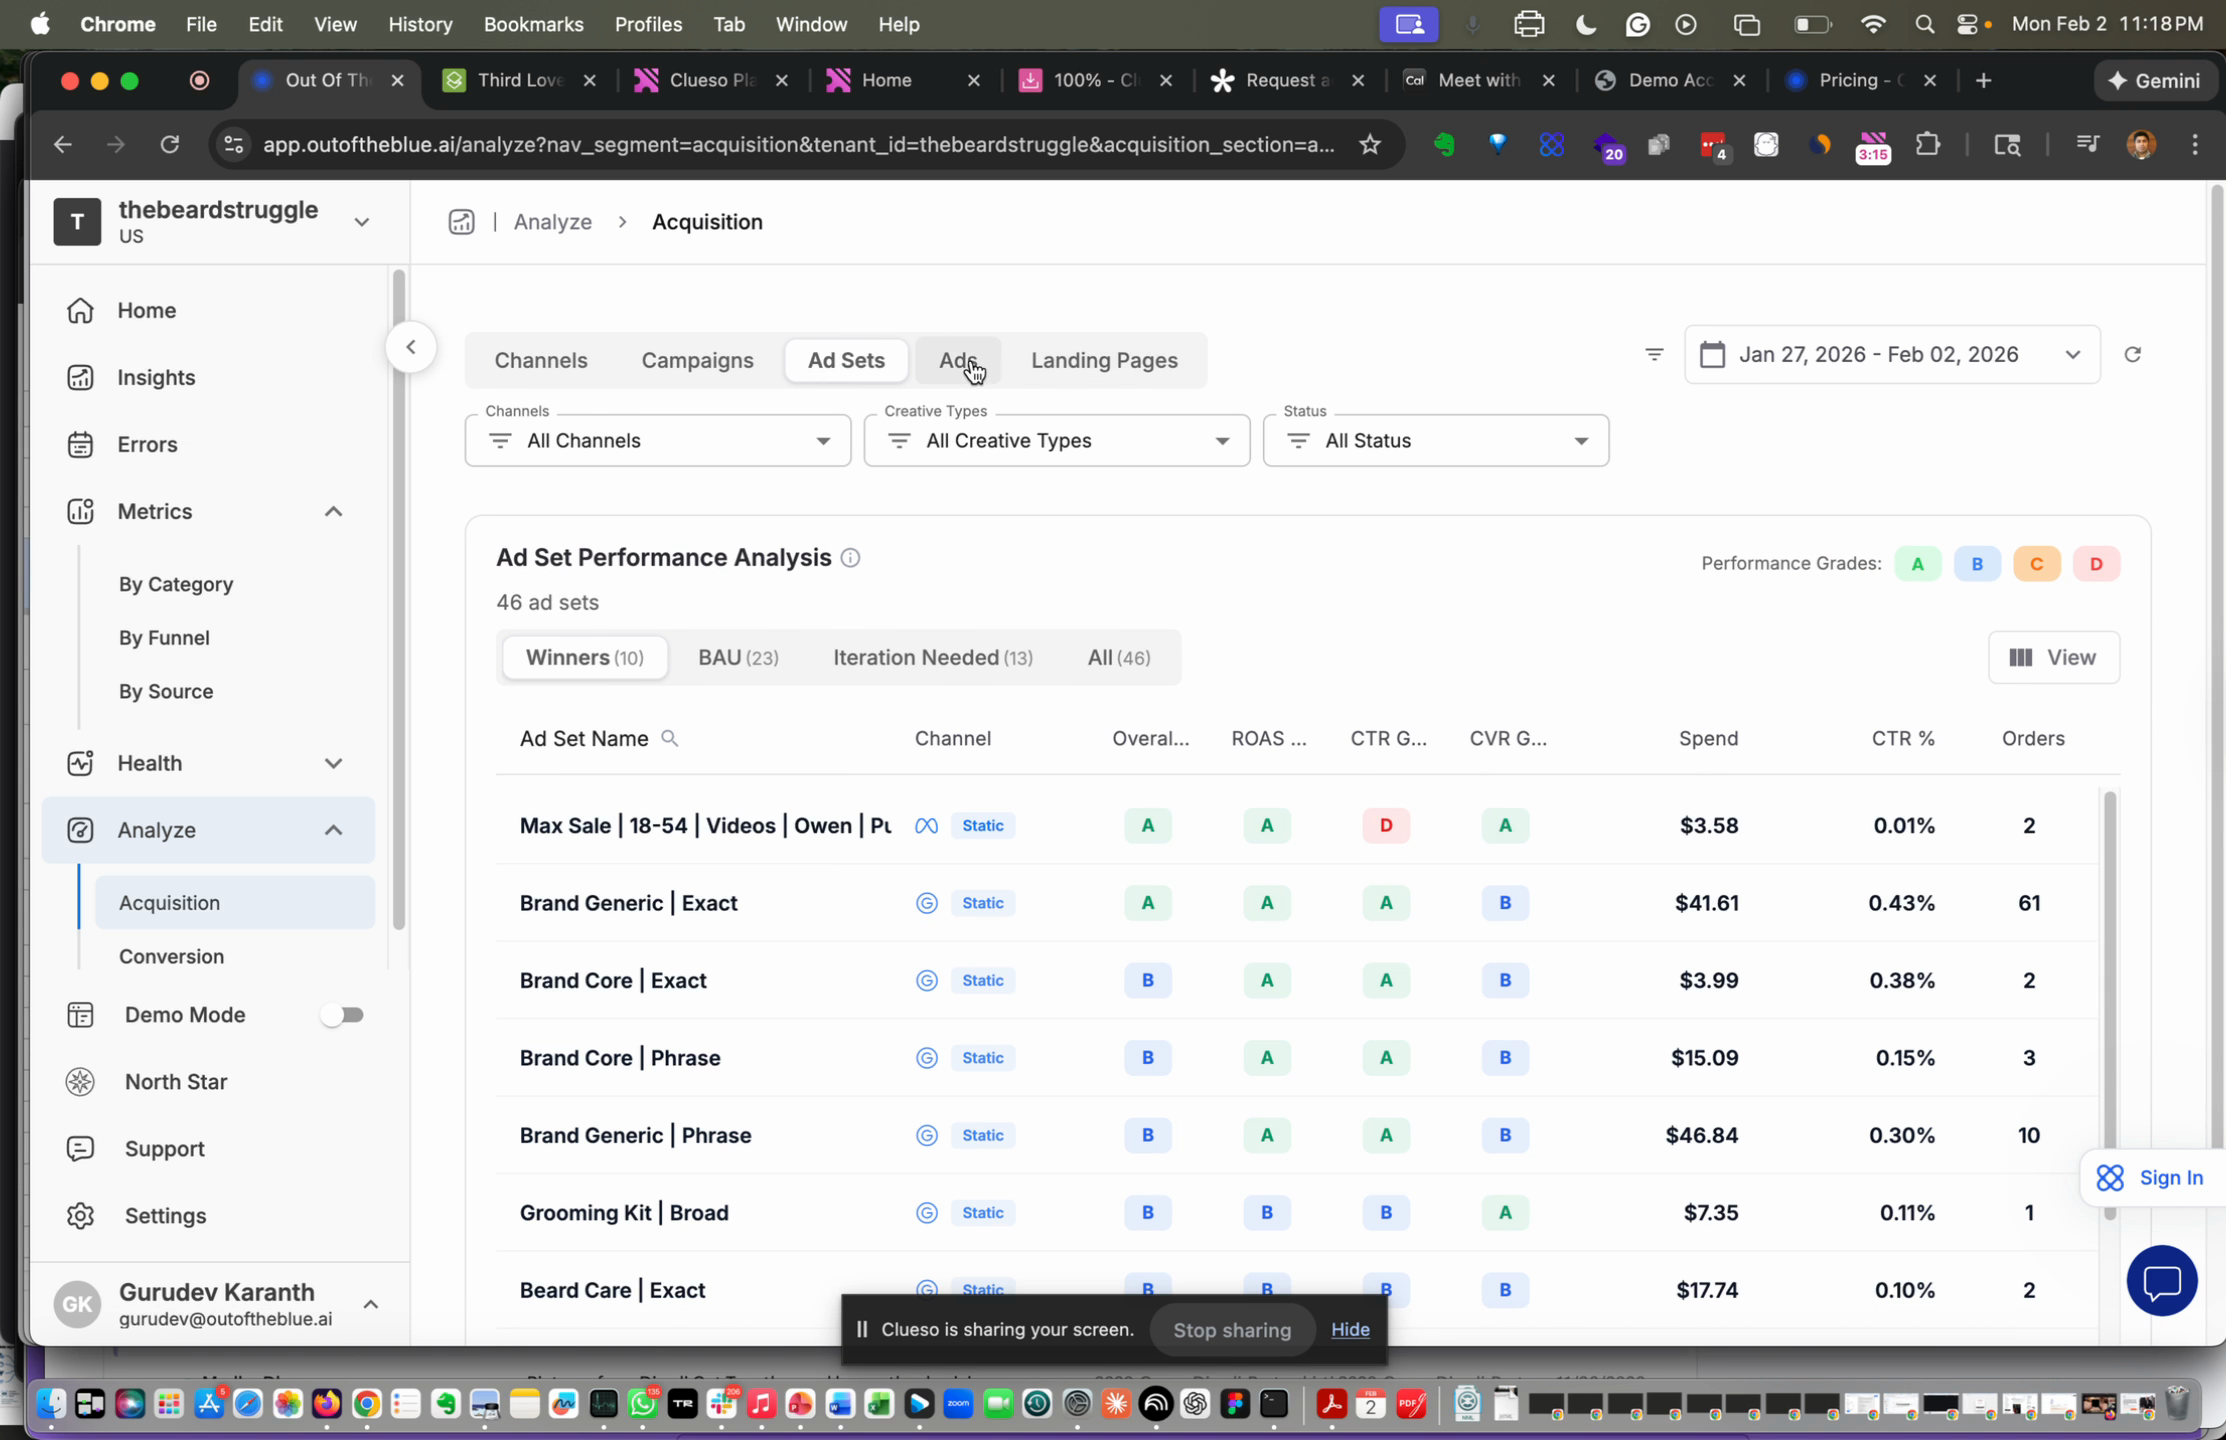
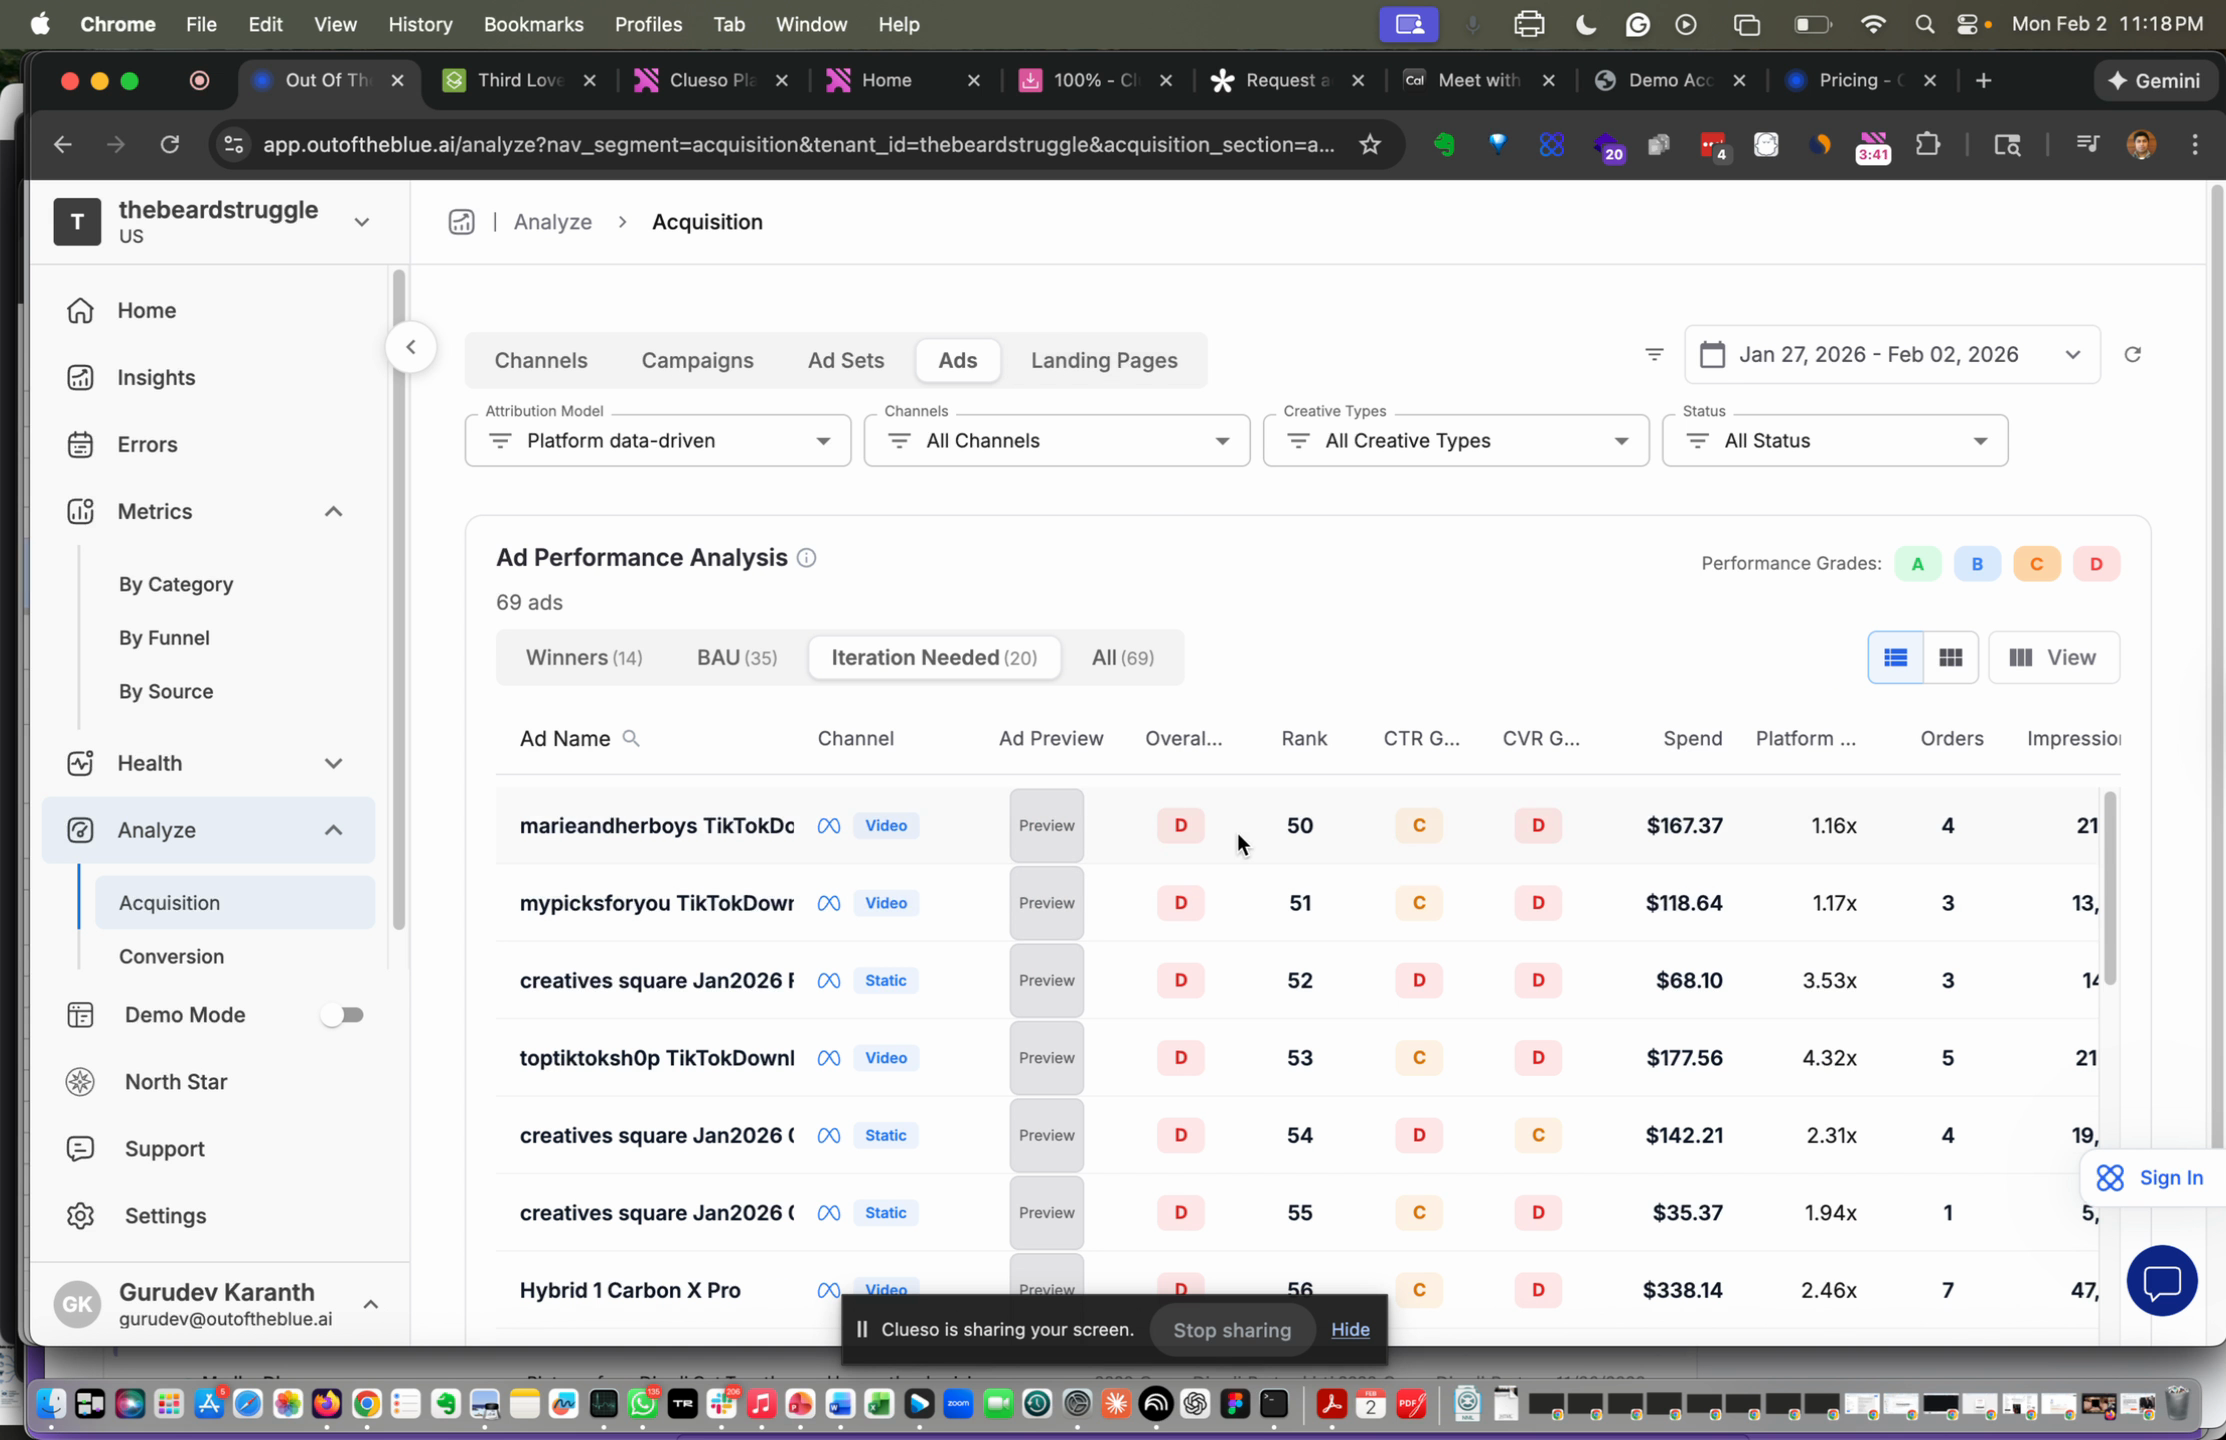
Step 14: Review campaign rankings. The app classifies campaigns as Winners, Business as usual, or Iteration needed. Each campaign gets scores for ROAS, TCC, CTR grade, and CBR grade. Use those grades to pinpoint whether issues stem from CTR or CVR.
Step 15: Drill down from campaign to ad set, ad, and landing page using the same scoring criteria.
Step 16: Switch between card view and list view to change how data displays.
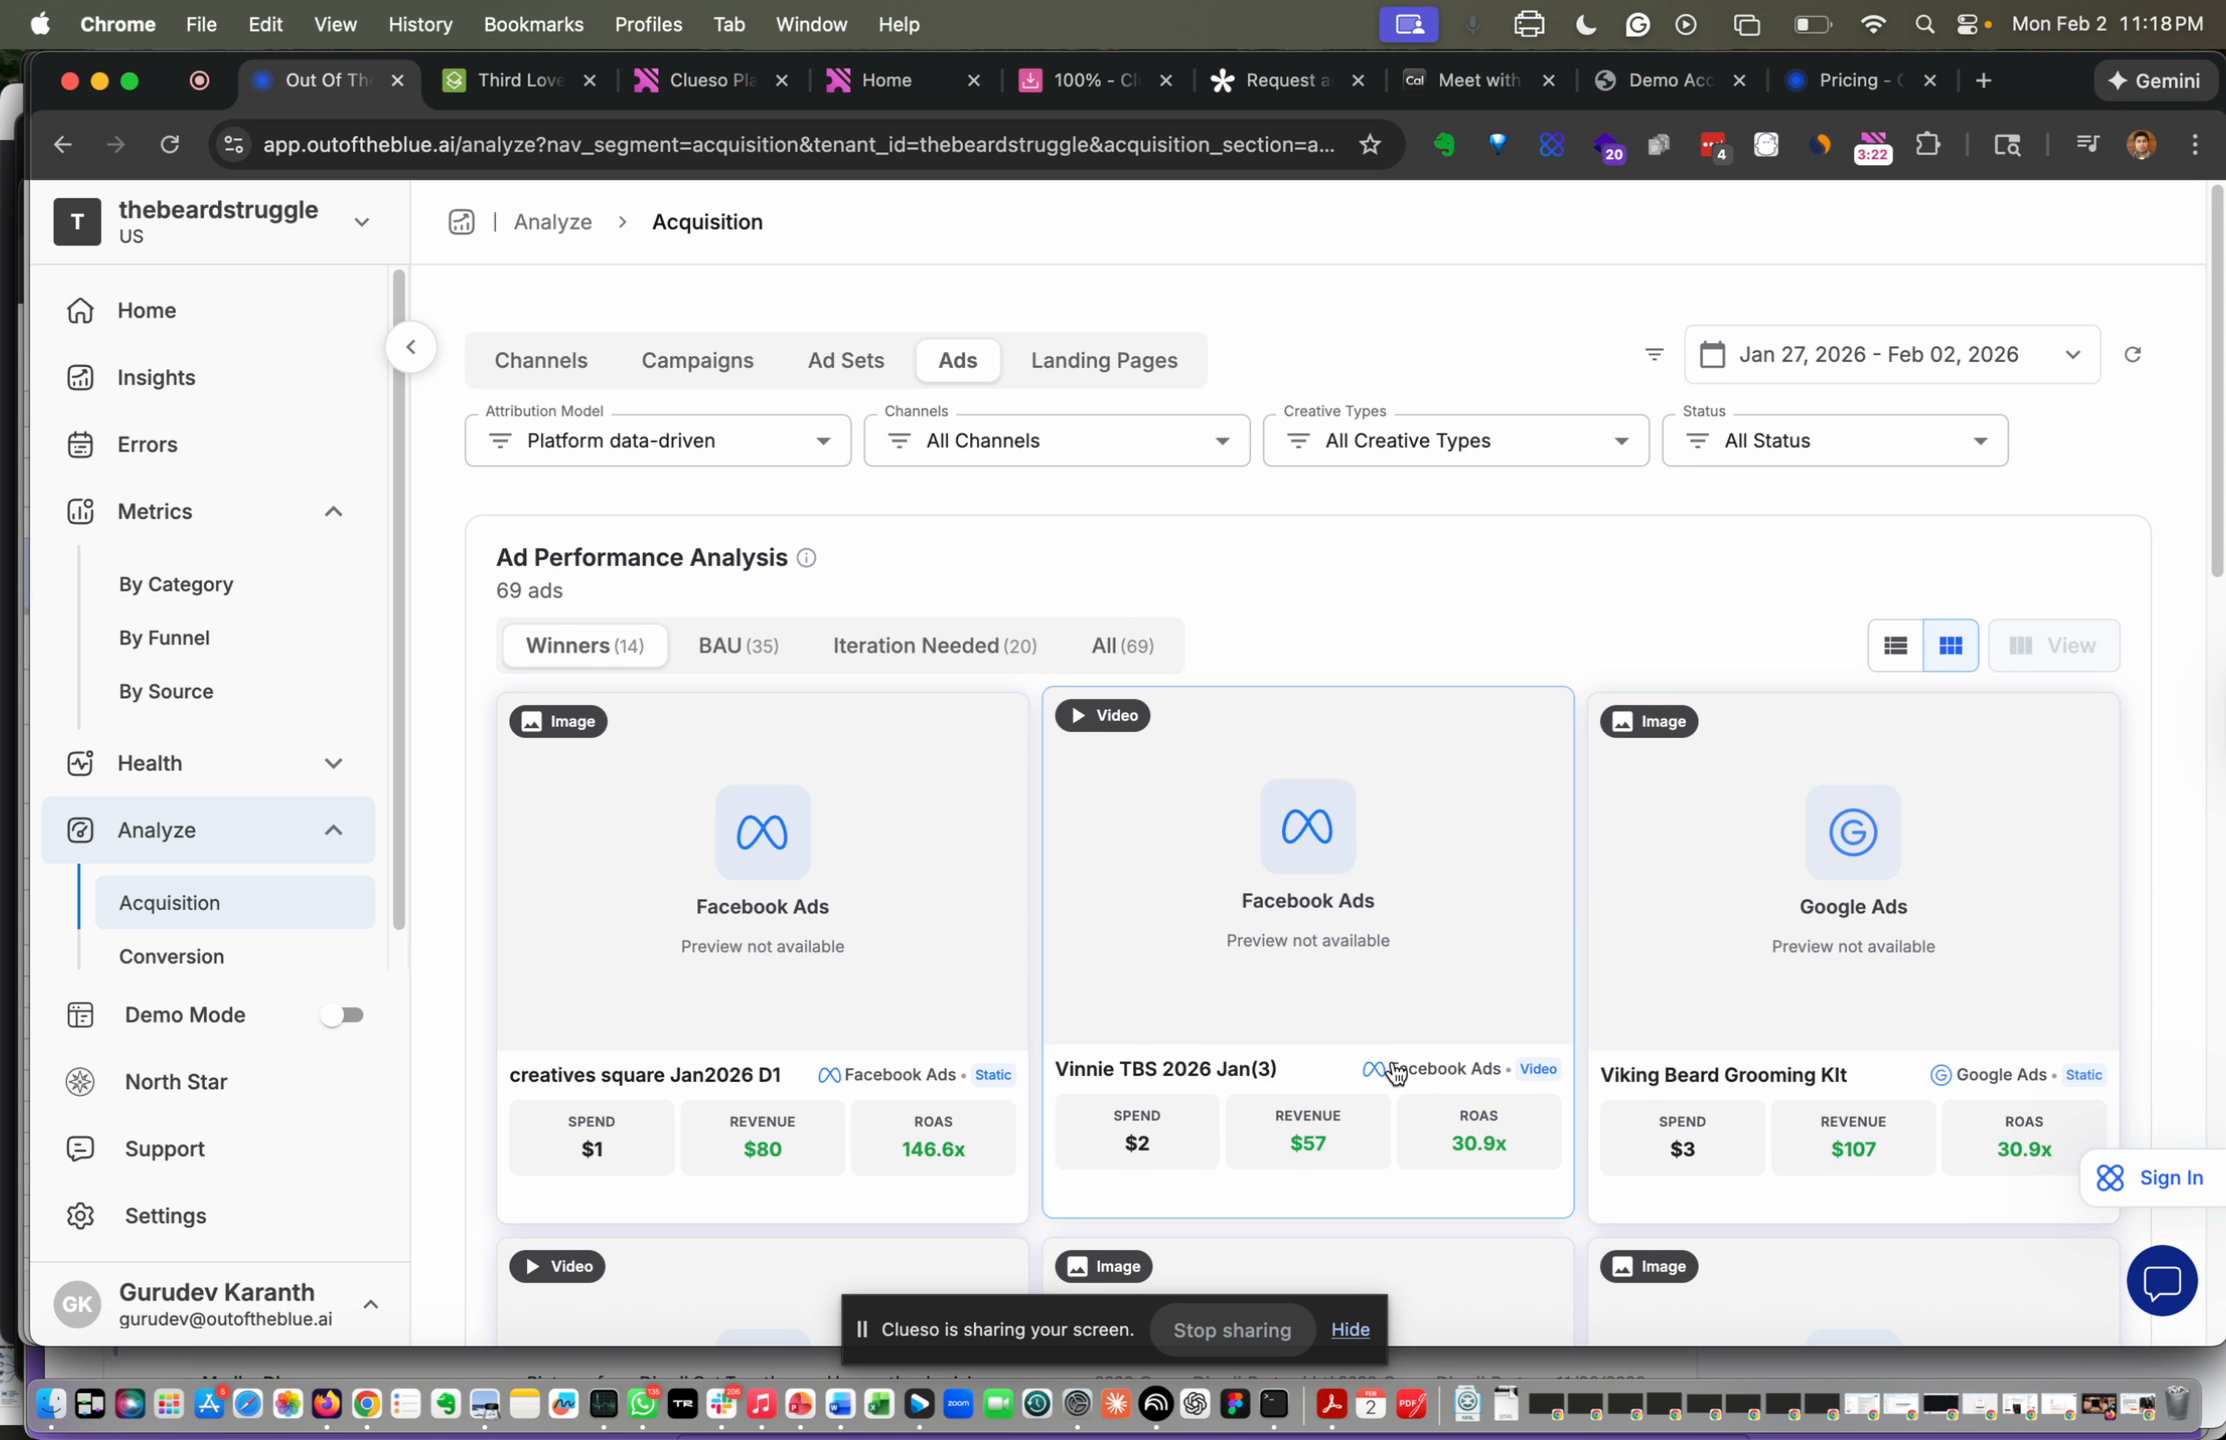
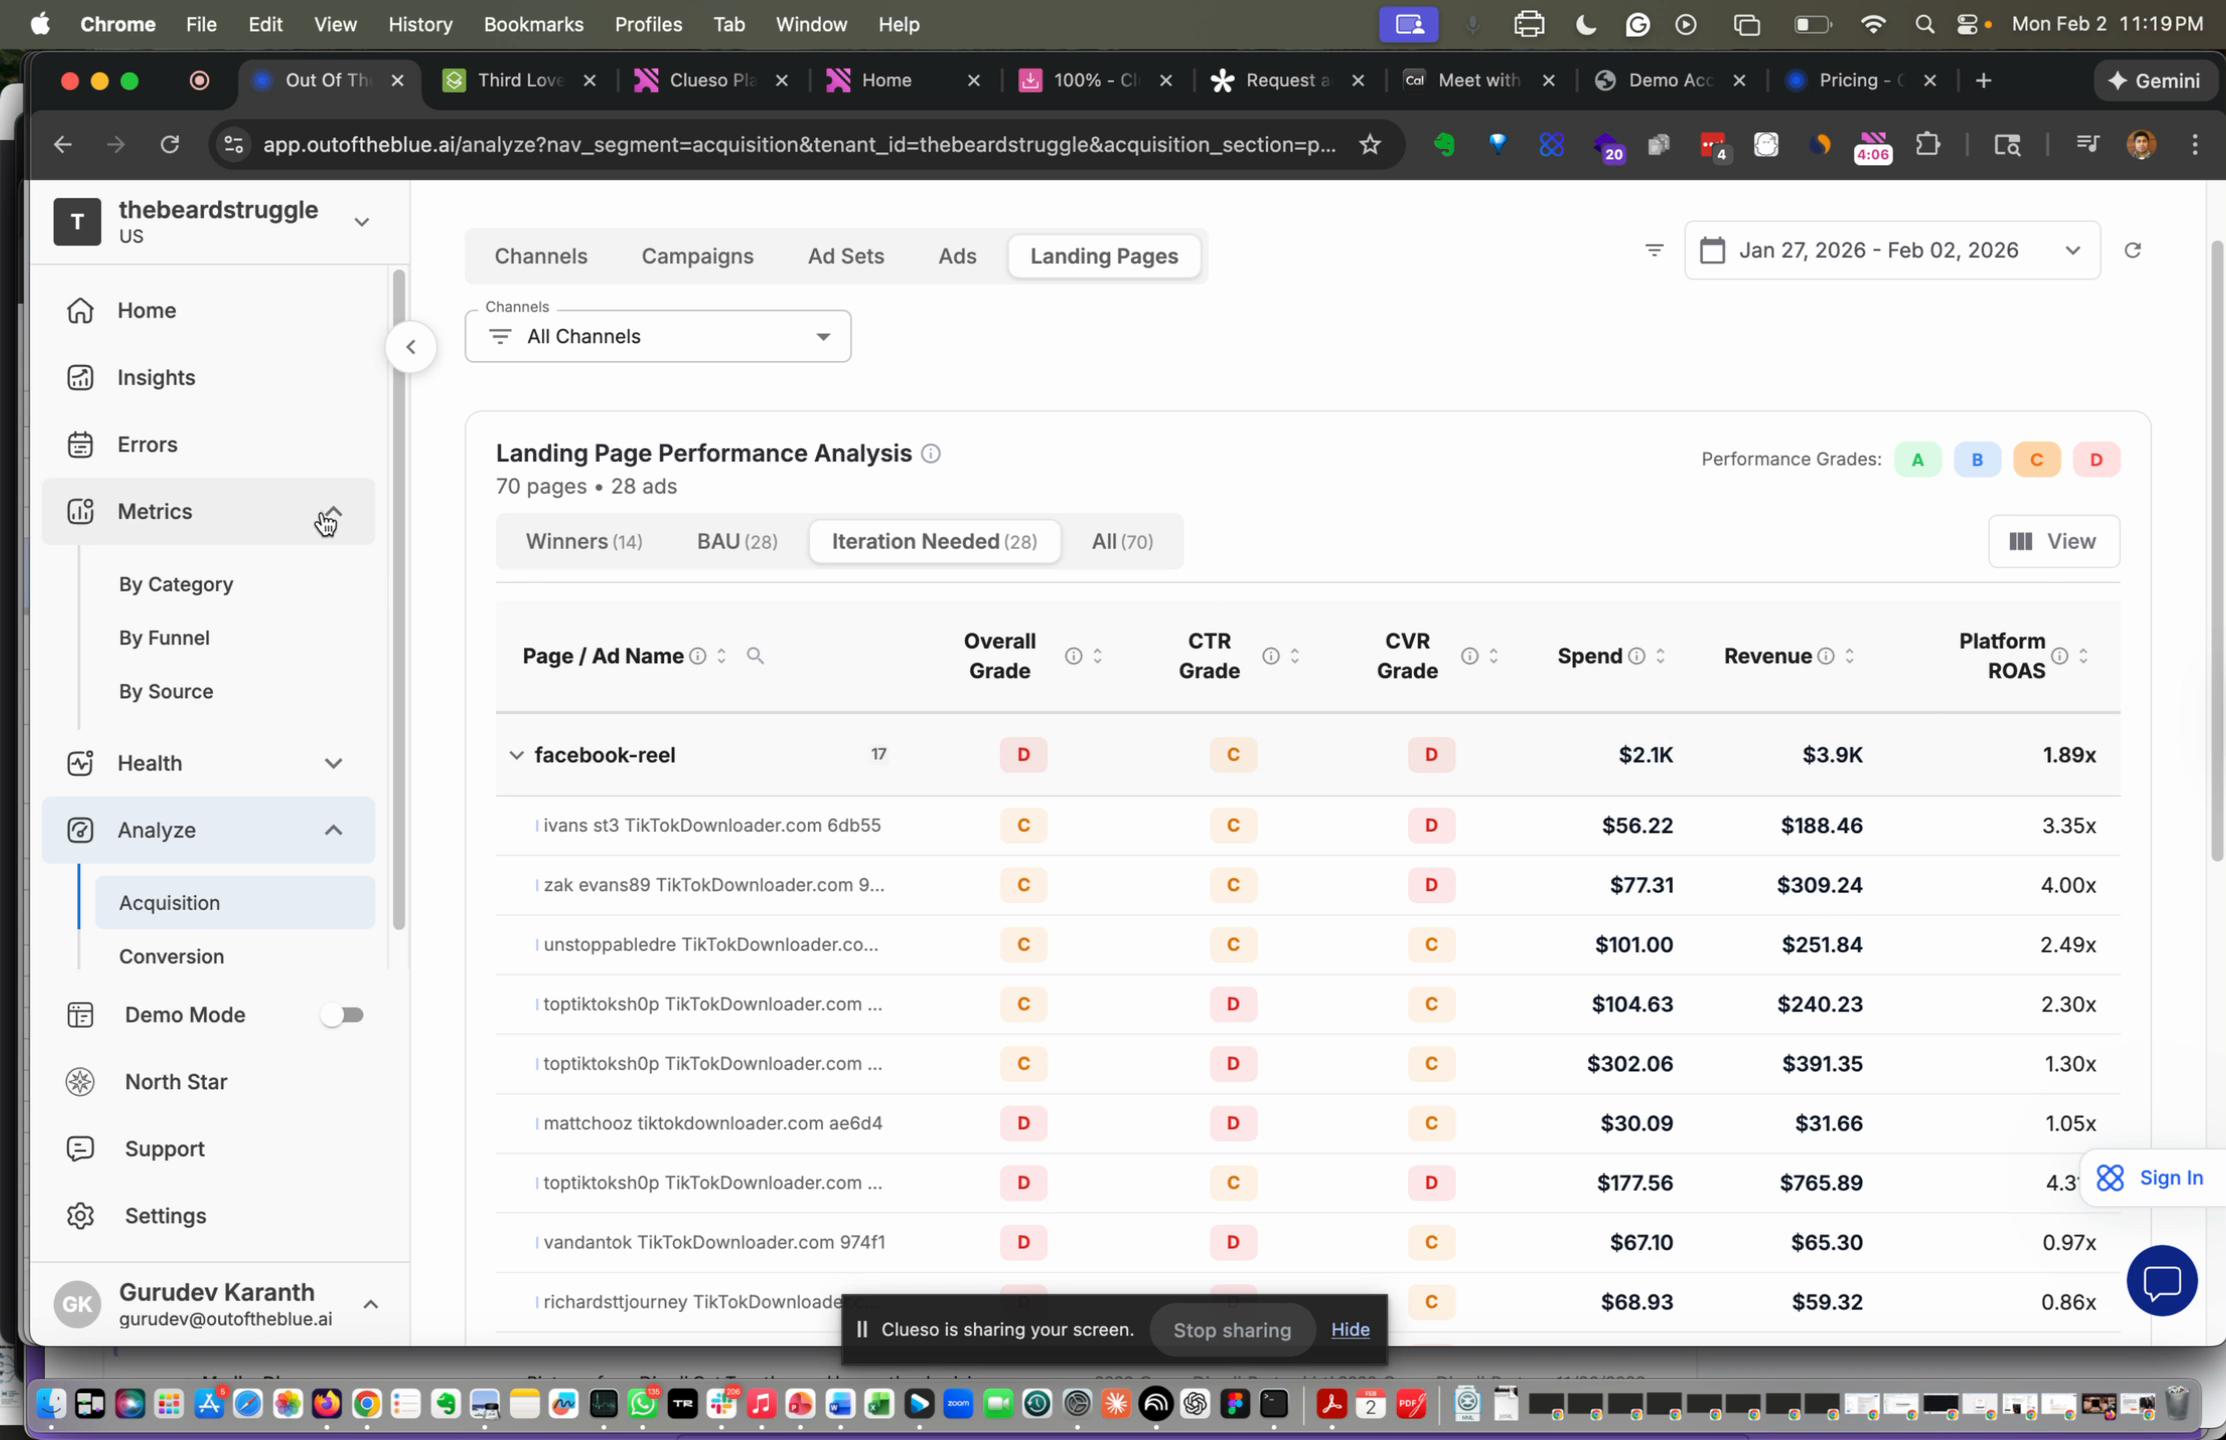
Step 17: Inspect the landing page view to see which ads drive each landing page, and review spend and revenue tied to those pages.
Step 1: Open the Conversion dashboard to see conversion KPIs and summaries across sites and channels.
Step 2: Review the conversion flow to identify drop‑offs and conversion points.
Step 3: Check session quality indicators in each table to understand traffic quality and conversion likelihood.
Conclusion
This app centralizes channel spend, site activity, conversions, and revenue in a single dataset. Use targets, automated daily summaries, the MCP, and hierarchical campaign scoring to spot winning campaigns, diagnose CTR vs CVR issues, and prioritize changes quickly.
Created on
Did you find this article helpful?